
Fig. S1
- ID
- ZDB-IMAGE-110608-30
- Genes
- Publication
- Knopf et al., 2011 - Bone Regenerates via Dedifferentiation of Osteoblasts in the Zebrafish Fin
- All Figures
- Figures for Knopf et al., 2011
|
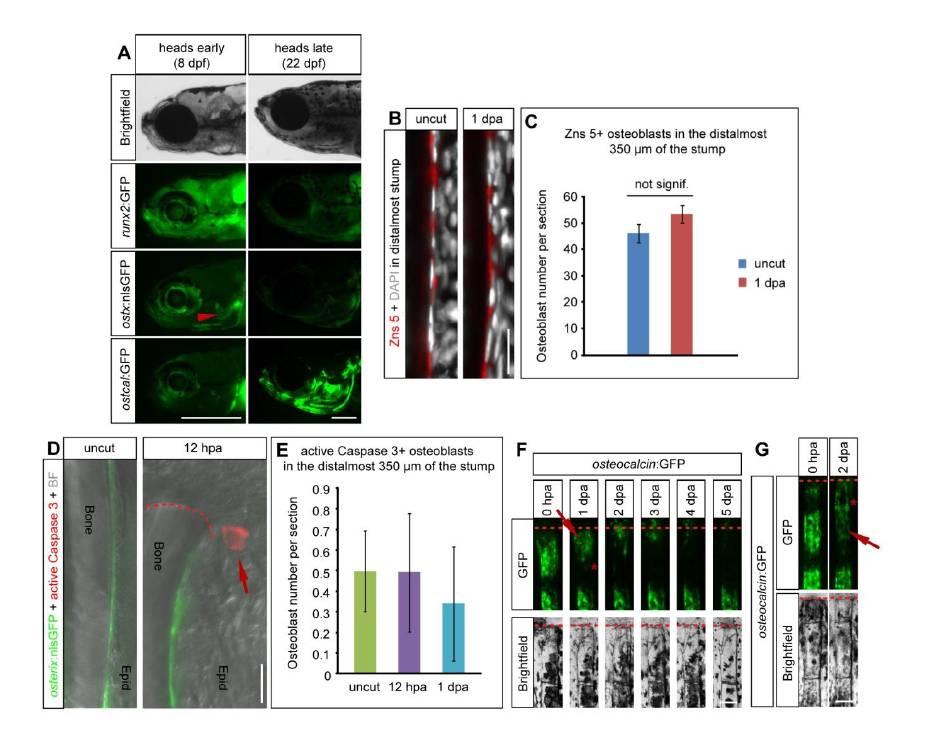
Fig. S1 Distally located stump osteoblasts dedifferentiate after amputation.
(A) Transgenic fish lines reporting runx2, osterix and osteocalcin promoter activity. During early larval skull development at 8 days post fertilization (dpf), transgenic runx2:GFP zebrafish show high GFP expression, while GFP signal in osterix:nlsGFP fish is restricted to few ossification centers (red arrowhead points to ossifying operculum). At this stage of development osteocalcin:GFP is hardly detectable beyond background fluorescence. In contrast, the forming head skeleton at a later stage (22 dpf) shows strong osteocalcin:GFP expression while runx2:GFP and osterix:nlsGFP expression are comparatively low. Larval heads are shown in brightfield and fluorescence illumination (GFP), the latter with a constant exposure time. Scalebars 500 μm.
(B-C) The number and density of Zns 5+ stump osteoblasts does not change after amputation.
(B) Zns 5+ and DAPI staining in uncut fins and the distal stump at 1 dpa shows that the density of osteoblasts does not change after amputation. (C) The average number of Zns 5+ osteoblasts in the distal stump (0 – 350 μm proximal to the amputation plane at 1 dpa or equivalent area in uncut fins) is shown ± s.e.m. n = 3 fish each, uncut: 18 sections, 1268 cells, 1 dpa: 19 sections, 1362 cells. Scalebar 20 μm.
(D-E) Apoptosis of osterix:nlsGFP+ osteoblasts is a rare event, that does not occur more frequently after amputation.
(D) Representative examples of osterix:nlsGFP uncut and 1 dpa fin rays stained with an anti-active Caspase 3 antibody. Apoptosis is not detectable in osteoblasts, but in an epidermal cell at 1 dpa (arrow). BF = Brightfield.
(E) The average number of osterix:nlsGFP+/active Caspase 3+ osteoblasts in the distal stump (0 – 350 μm proximal to the amputation plane at 1 dpa or equivalent area in uncut fins) is shown ± s.e.m. nuncut = 4 fish, 46 sections, n12hpa = 3 fish, 26 sections, n1dpa = 4 fish, 26 sections. Scalebar 10 μm.
(F-G) Progressive reduction and shift of GFP fluorescence in osteocalcin:GFP fish indicates downregulation of transgene expression and migration of stump osteoblasts towards the amputation plane irrespective of segment boundaries.
(F) Timecourse of the same live amputated fin ray as shown in the graph in Fig. 1F. Please note the reduction of GFP fluorescence at 1 dpa (arrow) which is coupled to a progressive distal shift of the signal resulting in a larger GFP negative region close to the segment boundary (asterisk). Scalebar 100 μm.
(G) Amputated live fin ray of an osteocalcin:GFP fish at 0 hpa and 2 dpa. Three stump segments proximal to the amputation plane are shown. The distalmost segment has been amputated in its center, which leads to GFP reduction in this and the adjacent stump segment (red arrow). Simultaneously, some GFP signal can be detected covering the former GFP negative segment boundary (asterisk) suggesting that GFP+ cells move distally. n = 5 fish, 43/52 rays. Scalebar 100 μm.
Reprinted from Developmental Cell, 20(5), Knopf, F., Hammond, C., Chekuru, A., Kurth, T., Hans, S., Weber, C.W., Mahatma, G., Fisher, S., Brand, M., Schulte-Merker, S., and Weidinger, G., Bone Regenerates via Dedifferentiation of Osteoblasts in the Zebrafish Fin, 713-724, Copyright (2011) with permission from Elsevier. Full text @ Dev. Cell