
Fig. 5
- ID
- ZDB-IMAGE-110527-35
- Publication
- McGrail et al., 2011 - Somatic mutagenesis with a sleeping beauty transposon system leads to solid tumor formation in zebrafish
- All Figures
- Figures for McGrail et al., 2011
|
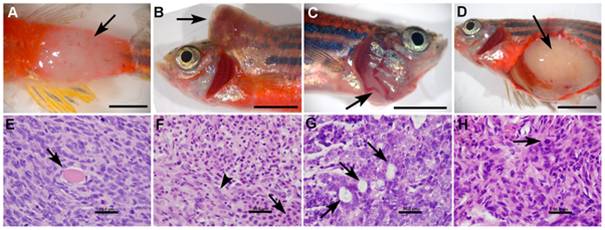
Fig. 5 Histopathologic features of solid tumors in T2/OncZ mutagenized fish.
(A–D) gross images of neoplasms in fish 1a, 2, 6, and 8 respectively. (E–H) Histopathology of zebrafish neoplasms: Hematoxylin and Eosin stained sections at 1000× magnification. (E) Spindle cell sarcoma from fish 1a, note entrapped skeletal muscle fibers (arrow). (F) Mixed neoplasm from fish 2, neoplastic round cells (arrow) were intermixed with neoplastic spindle shaped cells (arrow head). (G) Carcinoma from fish 6, neoplastic cells were arranged into multiple acinar structures (arrow). (H) Spindle cell sarcoma from fish 8, note the mitotic figure (arrow). Scale bar A–D, 0.5 cm; E–H, 50 μm.