
Fig. 3
- ID
- ZDB-IMAGE-110526-9
- Publication
- Van Raay et al., 2011 - Naked1 Antagonizes Wnt Signaling by Preventing Nuclear Accumulation of β-Catenin
- All Figures
- Figures for Van Raay et al., 2011
|
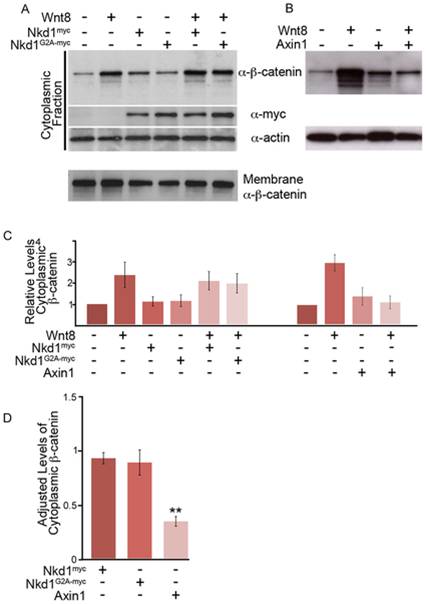
Fig. 3 Nkd1 does not affect cytoplasmic levels of β-catenin.
(A,B) Embryos were injected at the one stage with wnt8, nkd1myc or nkd1G2A-myc (A) or axin1 (B) and harvested at dome stage (4.3 hpf). Lysates were fractionated into plasma membrane (not shown) and cytosolic fractions, Western blotted and probed with anti-β-catenin, anti-myc and anti-actin antibodies. Each lane represents, on average, the equivalent of one embryo averaged from 10 embryos. (C) The average levels of cytosolic β-catenin from 6 independent experiments (Wnt8+/- Nkd1myc/Nkd1G2A-myc) or from 3 independent experiments (Wnt8+/-Axin1) were determined. Each lane was first normalized to actin levels and then compared to uninjected embryos, which was arbitrarily set to 1. D) To adjust for the differences between experiments described in (C), the ratio of cytoplasmic levels of β-catenin was determined for Wnt8+Nkd1myc:Wnt8 (N = 6), Wnt8+Nkd1G2A-myc:Wnt8 (N = 6) and Wnt8+Axin1:Wnt8 (N = 3) for each individual experiment and then averaged. (**-Students t-test, p = 0.0002). A level of one indicates no effect. Error bars represent standard error.