
Fig. 4
- ID
- ZDB-IMAGE-110526-11
- Publication
- Van Raay et al., 2011 - Naked1 Antagonizes Wnt Signaling by Preventing Nuclear Accumulation of β-Catenin
- All Figures
- Figures for Van Raay et al., 2011
|
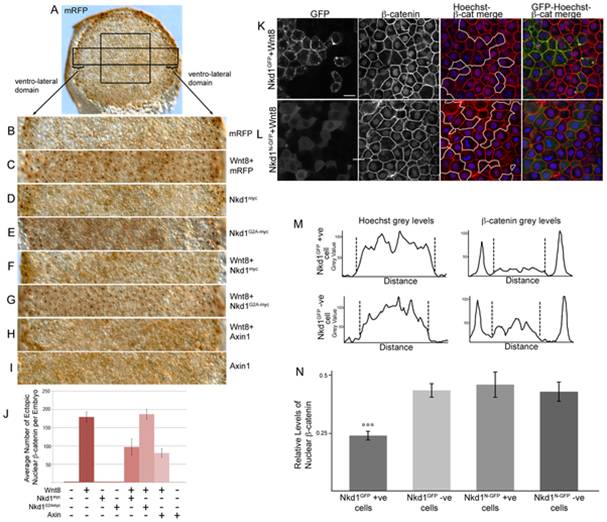
Fig. 4 Nkd1 inhibits accumulation of nuclear β-catenin.
(A–I) Embryos were injected at the one cell stage with mRFP (A,B); wnt8+mRFP (C); nkd1myc (D); nkd1G2A-myc (E); wnt8+nkd1myc (F); wnt8+nkd1G2A-myc (G); wnt8+axin1 (H); and axin1 alone (I). At dome stage (4.3 hpf) embryos were collected and processed for whole-mount immunohistochemistry with anti-β-catenin. The expression of nuclear β-catenin around the ventro-lateral margin of the embryo is due to endogenous Wnt8 activity. Note that Axin1 is also sufficient to prevent nuclear localization of β-catenin induced by endogenous Wnt8 activity. The box in (A) represents the size and position of analysis for (J). The rectangle in (A) depicts the regions shown in (B–I) which encompasses the ventro-lateral margins on either side of the embryo. (J) Blind counts of the number of cells expressing ectopic nuclear β-catenin was quantified (Table 2). Error bars represent standard error. To confirm the effect of Nkd1 on nuclear β-catenin, wnt8 RNA was co-injected with nkd1GFP (K) or nkd1N-GFP RNA (L) into 1 of 4 blastomeres, harvested at dome stage and processed for endogenous β-catenin staining. Regions of mosaic expression were chosen for analysis. Clones of Nkd1GFP or Nkd1G2A-GFP positive clones are outlined in white. Black and white images of GFP and β-catenin are shown for contrast. See also Fig. S1 for the complete set of images. (M-N) Quantification of the differences in nuclear β-catenin from six cells (Wnt8+Nkd1GFP) or 10 cells (Wnt8+Nkd1N-GFP) cells each for GFP positive/Hoechst positive and juxtaposed GFP negative/Hoechst positive cells. The graphs in (M) represents the two cells identified by asterisks in the right hand-most image of (K). The dashed lines delineate the nuclear grey levels. (N) The level of nuclear β-catenin was adjusted using the Hoechst staining. Only the grey values located between the dashed lines were evaluated. (p value = 0.0002). Error bars represent std error. Scale bar represents 20 μM.