
|
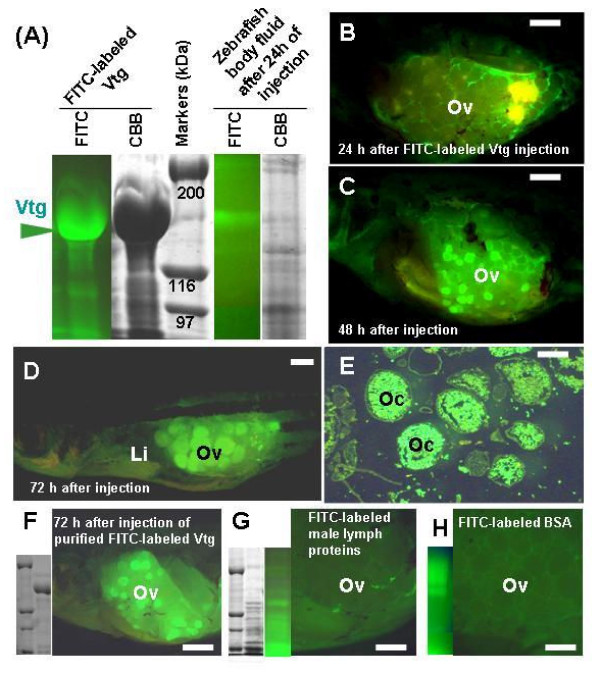
Fig. 3
Preparation and subsequent monitoring of FITC-labeled Vtg accumulation in the ovary after abdominal injection. (A) SDS-PAGE analysis of eye-sac lymph proteins after FITC labeling (two leftmost lanes), and assessment of FITC-labeled Vtg stability in zebrafish body fluid (two rightmost lanes). Leftmost lane shows FITC-fluorescence, indicating strong emission from Vtg, and the next lane shows the same gel stained with Coomassie Brilliant Blue (CBB). Of the two rightmost lanes, the first shows FITC-fluorescence in zebrafish body fluid collected 24 h after injection of FITC-labeled Vtg solution into the abdominal cavity, and the next lane shows the same sample stained with CBB. (B-D) Fluorescent images of zebrafish with the left abdominal wall dissected at 1, 2 and 3 days after injection of FITC-labeled Vtg solution. (E) Section of the zebrafish ovary shown in D. (F) SDS-PAGE of purified FITC-labeled Vtg and its incorporation into oocytes. (G) SDS-PAGE of FITC-labeled male goldfish lymph, and zebrafish ovary 72 h after injection of this solution. (H) SDS-PAGE of FITC-labeled BSA, and zebrafish ovary 72 h after injection of this solution. Li: liver; Oc: oocyte; Ov: ovary. Scale bar = 2 mm in B-D and F-H, 200 μm in E.