
Fig. S8
- ID
- ZDB-IMAGE-110429-25
- Publication
- Fujita et al., 2011 - Assembly and patterning of the vascular network of the vertebrate hindbrain
- All Figures
- Figures for Fujita et al., 2011
|
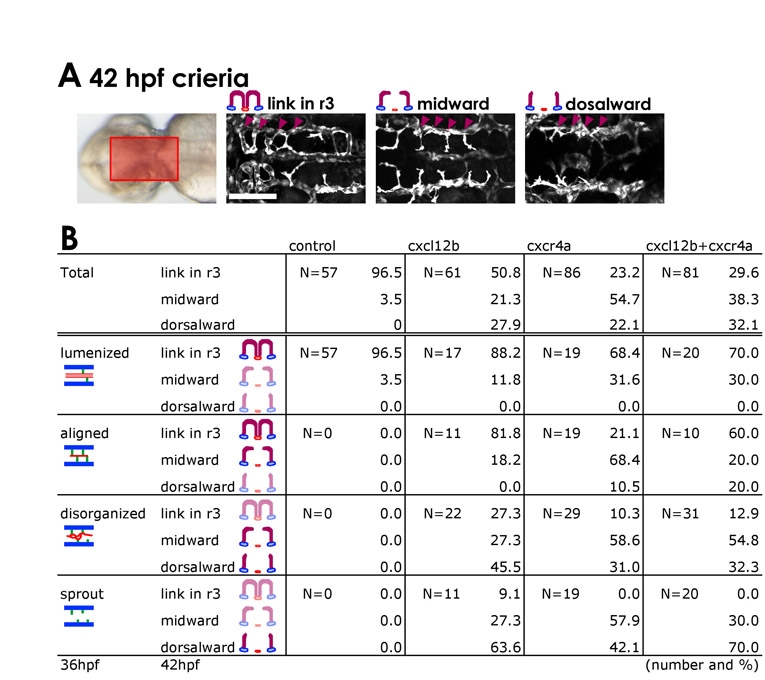
Fig. S8
Relationship between central artery and basilar artery phenotypes in cxcr4a morphants. Embryos with more severe BA formation defects subsequently reveal more severe defects in CtA growth towards, and connection to, the BA. (A) Transmitted light image (left) shows the region of the hindbrain imaged in the adjacent panels. The remaining panels show typical confocal images of the three categories of r3 CtA phenotype in 42 hpf MO-injected Tg(fli1a:EGFP)y1 embryos. Embryos were first classified at 36 hpf based on their BA phenotype and then reclassified at 42 hpf based on their r3 CtA phenotype. ′Link in r32, ′midward′ and ′dorsalward′ mean that the CtA in r3 is already linked with the BA (normal for this stage), fully extended dorsally and turned medially or ventral-medially, and extending dorsalwards but not turning medially, respectively. (B) Quantification of 36 hpf BA phenotypes and subsequent 42 hpf r3 CtA phenotypes in the same animals. The number of embryos analyzed for each MO injection (N) and the 36 hpf BA phenotype class is shown in each box, along with the percentages of these embryos that subsequently fall into each of the three CtA phenotypic classes. Scale bar: 50 μm.