
Fig. 5
- ID
- ZDB-IMAGE-110322-40
- Publication
- Chun et al., 2011 - Fli+ etsrp+ Hemato-Vascular Progenitor Cells Proliferate at the Lateral Plate Mesoderm during Vasculogenesis in Zebrafish
- All Figures
- Figures for Chun et al., 2011
|
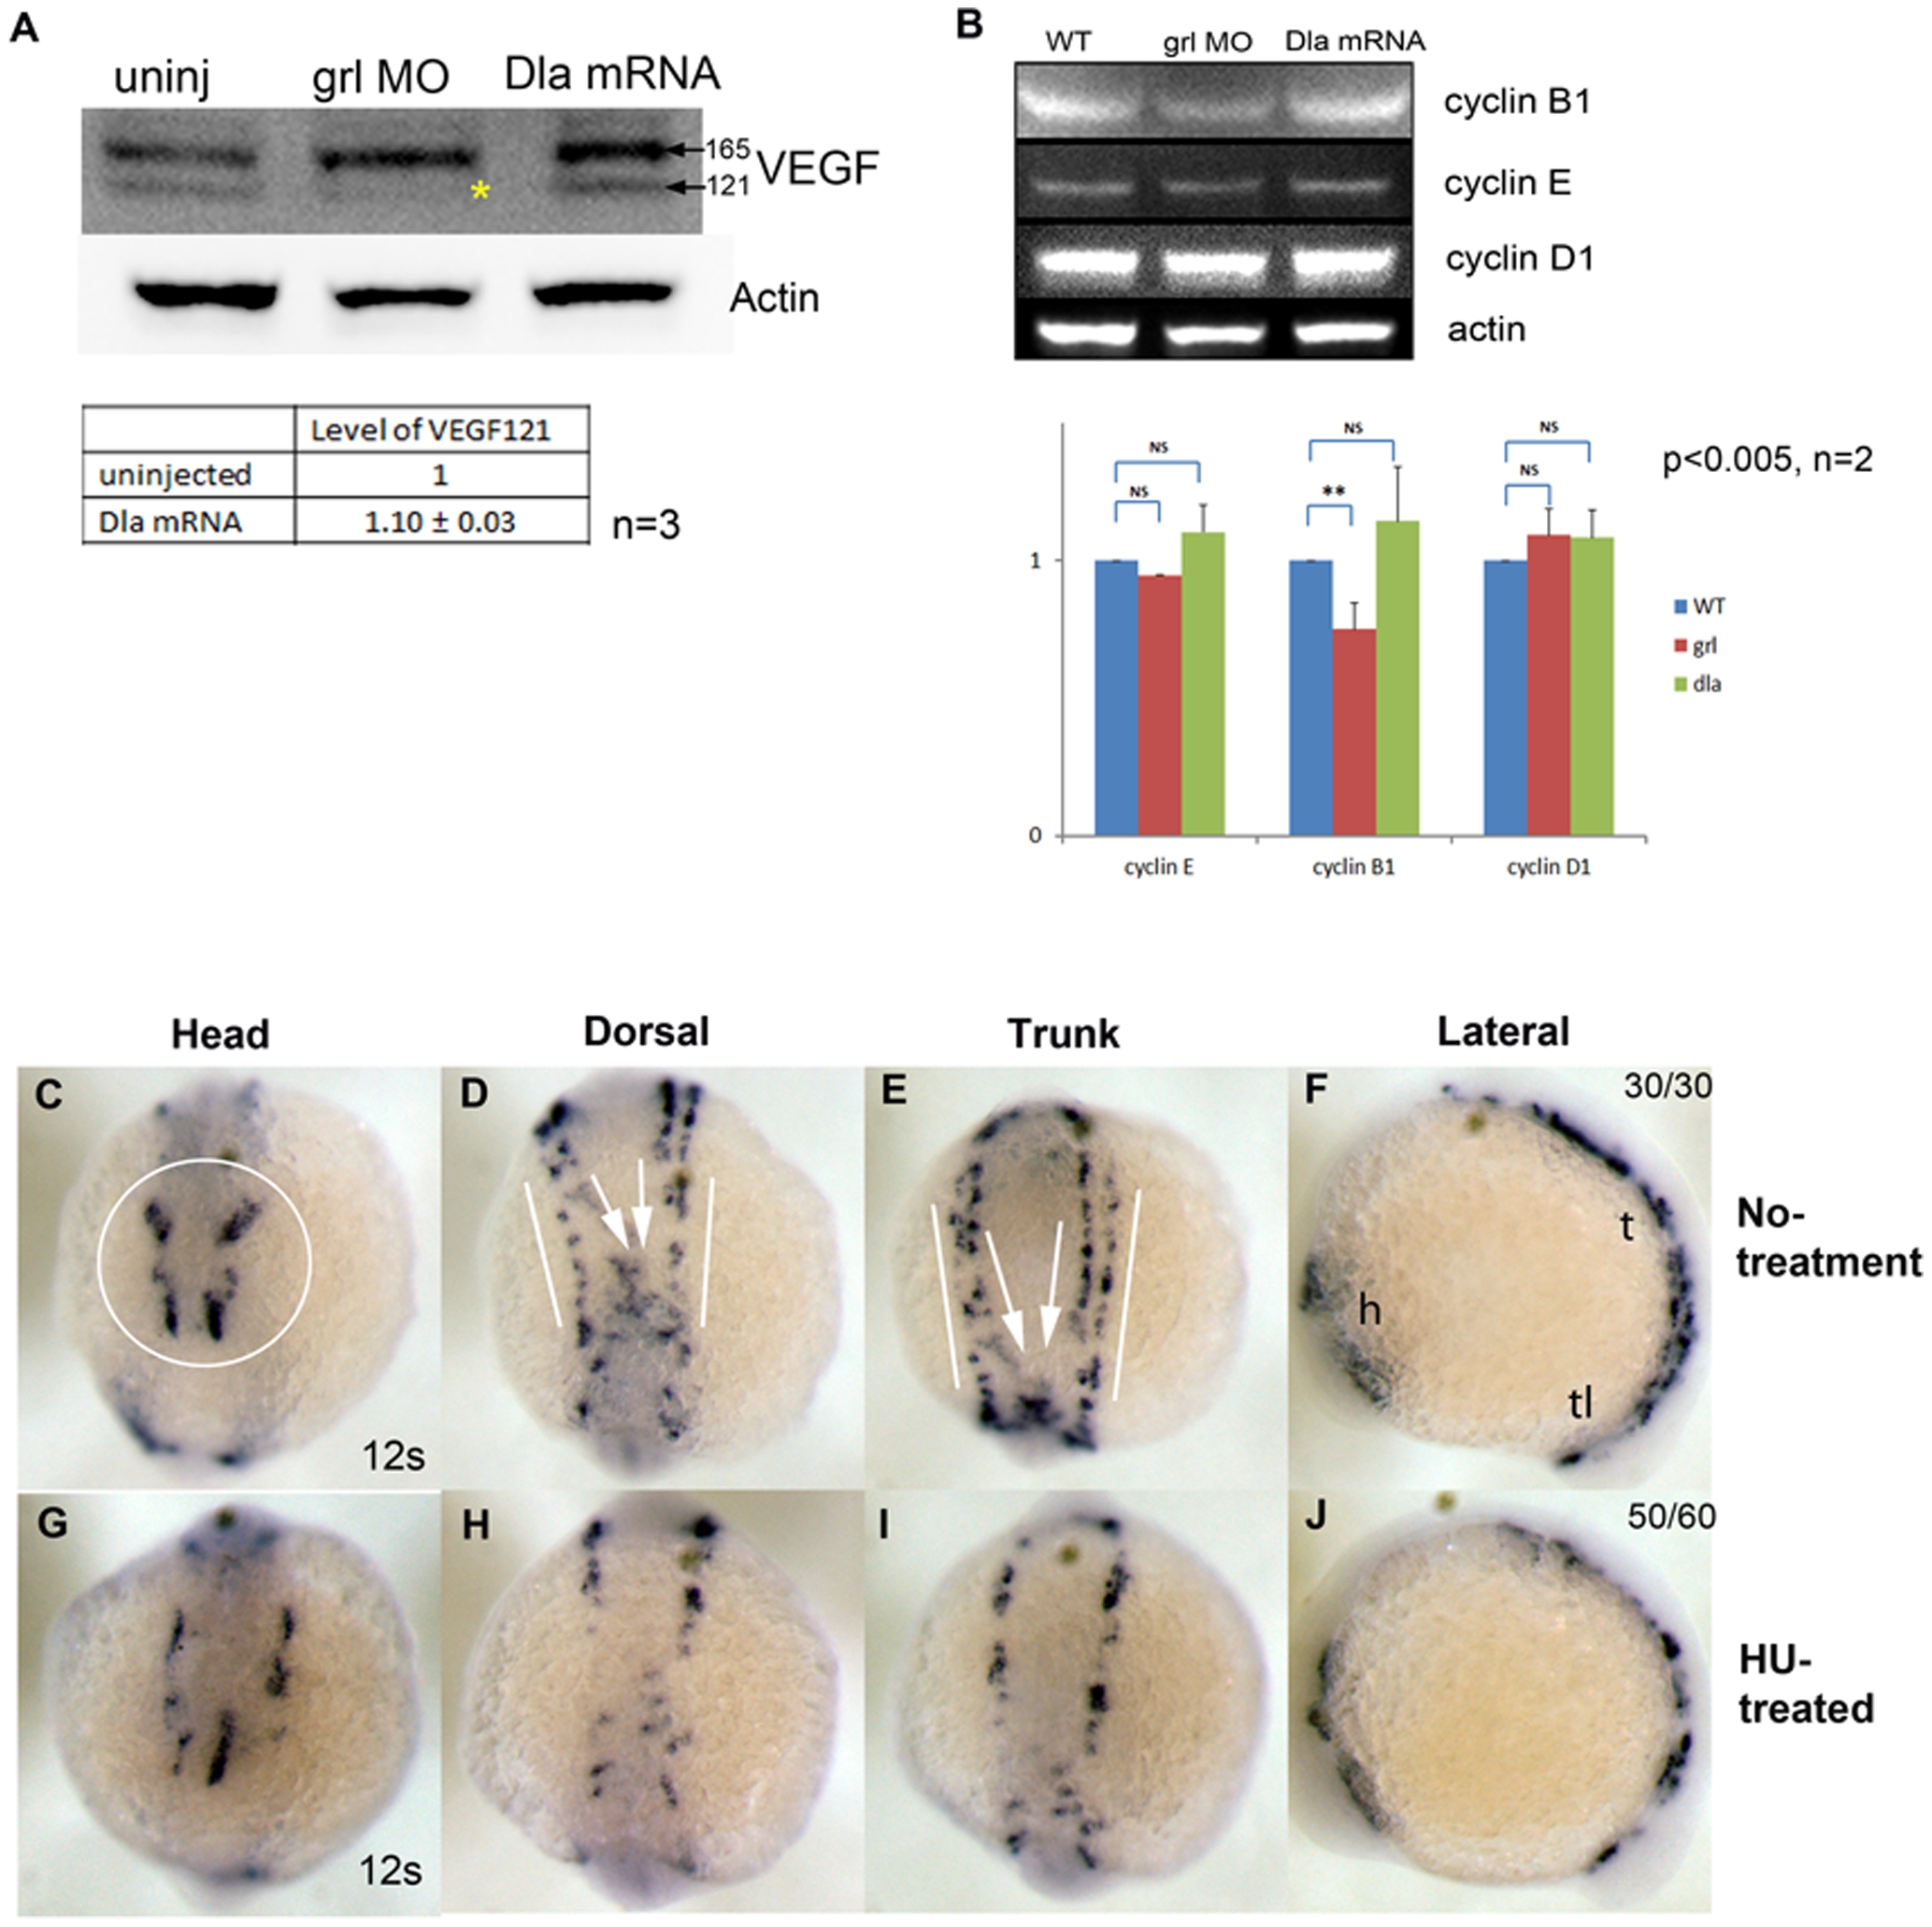
Fig. 5 Cell cycle analysis in 10 som embryos.
(A) Overexpression of deltaA mRNA and KD of grl shows complementary changes in protein levels for VEGF121 at 10 som. (B) Western blot analysis using total protein from uninjected, grl MO, and deltaA mRNA-injected embryos showed reduction of cyclin B1 in grl MO injected embryos, and slight induction of cyclin B1 in deltaA mRNA-injected embryos. No change was observed in cyclin E and D1 levels in deltaA mRNA or grl MO-injected embryos. The graph shows quantitation of the western blots with error bars representing SEM (n = 2, p<0.005). (C-J) These panels compare hydroxyurea (HU)–treated (G-J) embryos to untreated embryos (C-F). Treatment of HU, cell cycle inhibitor from 1 to 10 som embryos resulted in reduction of etsrp+ cells at the LPM (G-J) at 12 som. In untreated embryos, normal etsrp expression patterns were shown as four sets of etsrp+ cells in head (C, circle), migrating (D and E, white arrows) and stationary (D and E, white lines) etsrp+ cells in dorsal and trunk. h, head; t, trunk; tl, tail in N. (See also Figure S4 and Figure S6). The numbers on the top right panel of all ISH embryos in this figure indicate number of embryos out of total number displaying that particular phenotype.