
Fig. 4
- ID
- ZDB-IMAGE-110214-66
- Genes
- Publication
- Ohata et al., 2011 - Dual Roles of Notch in Regulation of Apically Restricted Mitosis and Apicobasal Polarity of Neuroepithelial Cells
- All Figures
- Figures for Ohata et al., 2011
|
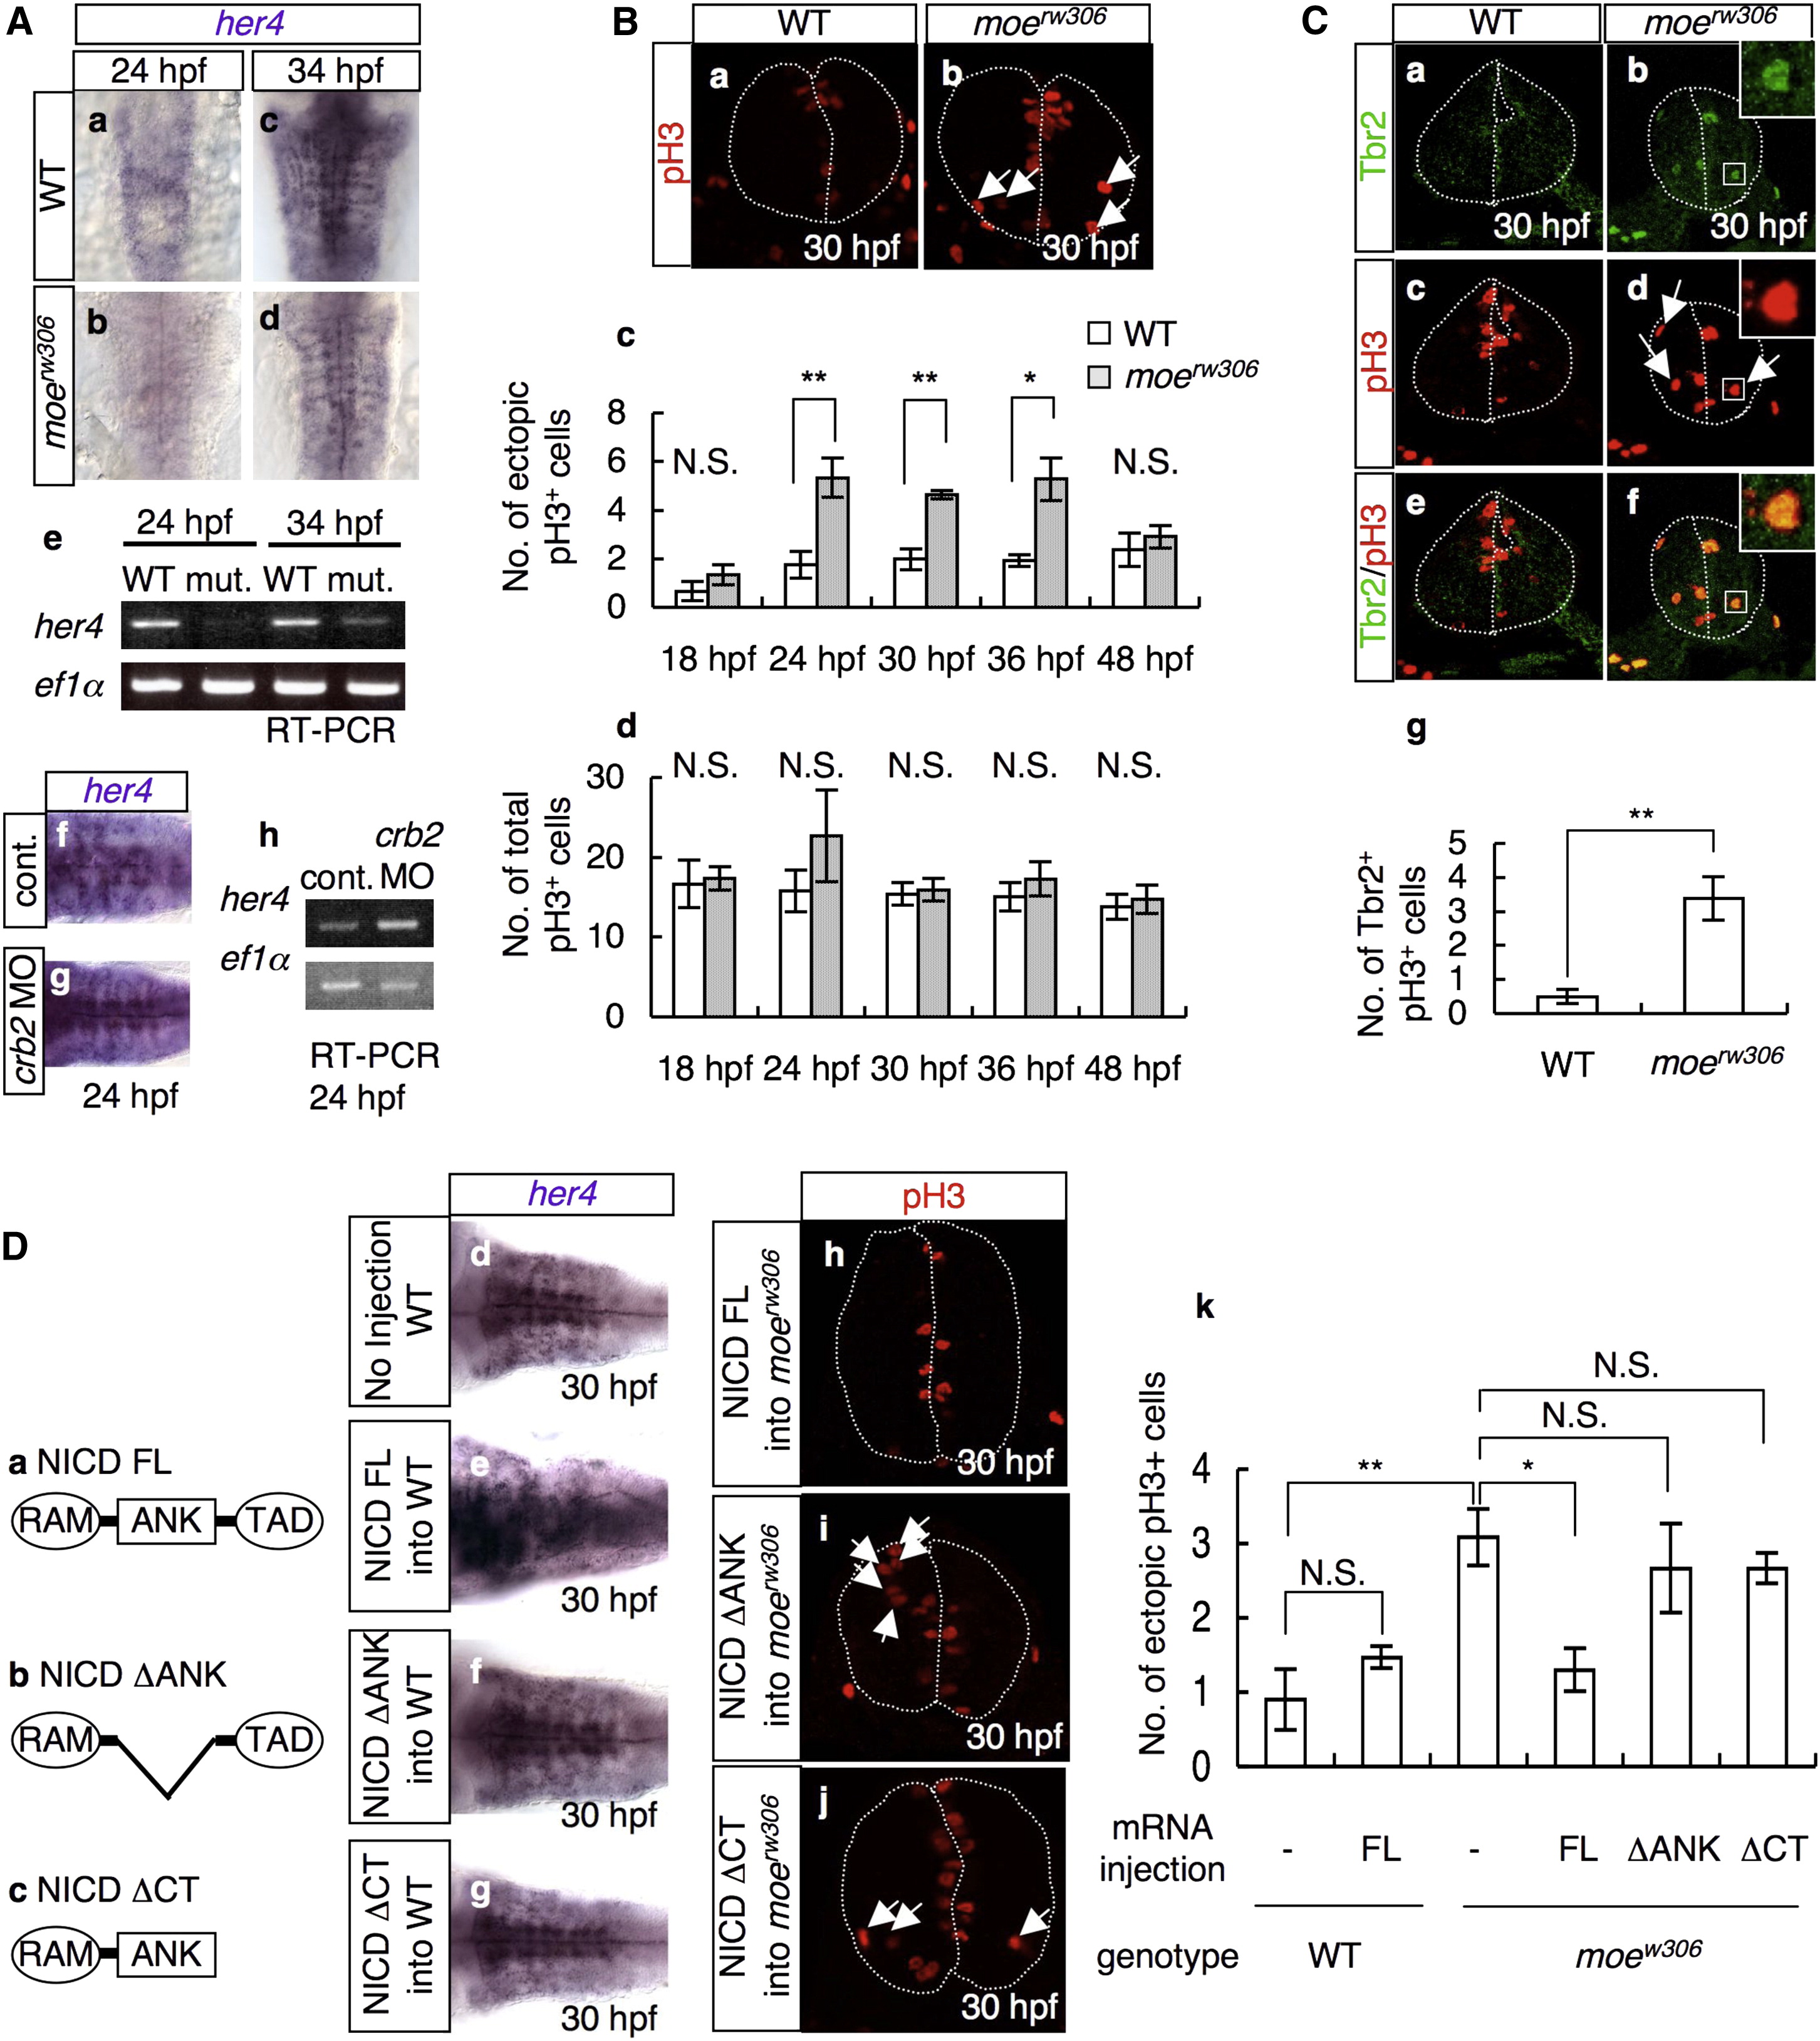
Fig. 4 Decreased Notch Activity in the moerw306 Mutant Affects the Position of Mitosis
(A) In situ hybridization analysis of her4 in the WT (a and c), moerw306 mutant (b and d), control morphant (f; 50 µg/ml), and crb2 morphant (g; 50 µg/ml) embryos at 24 hpf (a, b, f, and g) and 34 hpf (c and d) (dorsal views; a–d, rostral to the top; f and g, rostal to the left), and RT-PCR analysis of the cDNAs synthesized from the total RNA samples from the whole bodies of WT, moerw306 (mut.), control morphant (cont.), and crb2 morphant (crb2 MO) embryos at 24 hpf and 34 hpf (e and h).
(B) Mitotic cells visualized by staining with anti-phospho-histone H3 (pH3; red) of the WT (a) and moerw306 mutant (b) embryos at 30 hpf. Cross-sectional views, dorsal to the top. Arrows indicate mitotic cells that are proliferating away from the ventricular zone. The dotted lines indicate the outlines of the neural tubes and the midlines. (c and d) The number of ectopically dividing cells (c) and the total number of mitotic cells (d) were assessed in 20 μm thick sections. White bars indicate WT; gray bars indicate moerw306 mutant (c and d). Data shown are mean ± SEM; *p < 0.05; **p < 0.01; N.S. is an abbreviation for not significant.
(C) Immunohistochemical detection of Tbr2 (a and b; green) and pH3 (c and d; red) in the WT (a and c) and moerw306 mutant (b and d) embryos at 30 hpf. Merged images of the signals associated with Tbr2 and pH3 are shown in (e and f). Cross-sectional views, dorsal to the top. Arrows in (d) indicate mitotic cells that are proliferating away from the ventricular zone. (g) The numbers of Tbr2, pH3-double-immunoreactive cells (Tbr2+, pH3+) at 30 hpf were assessed in 10 μm thick sections. Data shown are mean ± SEM; **p < 0.01.
(D) (a–c) Structures of NICD FL (a), NICD ΔANK (b), and NICD ΔCT (c). The following abbreviations are used: RAM, RBP-J association module; ANK, ankyrin repeats; TAD, transactivation domain. (d–g) The levels of her4 mRNA were assessed by in situ hybridization of the WT embryos injected with or without the indicated mRNAs (e and f; 60 μg/ml and g; 20 μg/ml). (h–k) The moerw306 mutants (mut.) were injected with NICD FL (h; 60 μg/ml), NICD ΔANK (i; 60 μg/ml) and NICD ΔCT (j; 20 μg/ml) mRNA species and the numbers of ectopic mitotic cells in 20 μm thick sections were quantified (k). Arrows indicate ectopic mitotic cells; dotted lines indicate neural tubes and midlines. Data shown are mean ± SEM; *p < 0.05; **p < 0.01; N.S. is an abbreviation for not significant.