
Fig. 6
- ID
- ZDB-IMAGE-110214-60
- Publication
- Maurya et al., 2011 - Integration of Hedgehog and BMP signalling by the engrailed2a gene in the zebrafish myotome
- All Figures
- Figures for Maurya et al., 2011
|
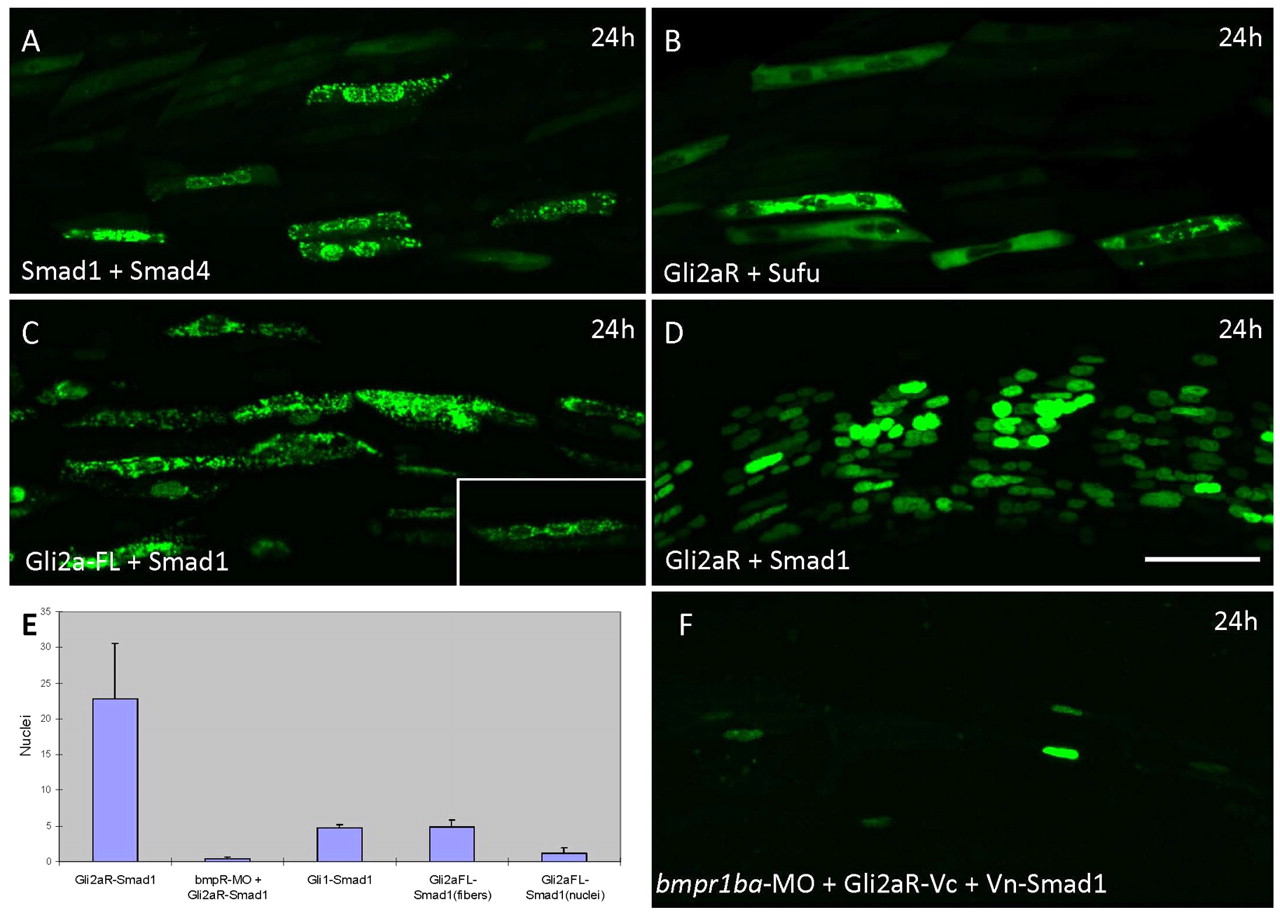
Fig. 6 Bi-fluorescence complementation assay for in vivo protein-protein interactions. Parasagittal sections of live embryos injected with constructs expressing Vn- and Vc-tagged protein pairs from the same UAS promoter and imaged at 24 hours. (A) Smad1/Smad4: note speckled appearance of signal, which shows a cytoplasmic and perinuclear localisation. (B) Gli2aR/SuFu; signal is localised to the cytoplasm and excluded from the nucleus. (C) Gli2a-FL/Smad1; note speckled appearance of signal, which shows a cytoplasmic and perinuclear localisation (see inset). (D) Gli2aR/Smad1; most fibres in each somite are positive for the Venus signal, localised exclusively to the nucleus. (E) Histogram showing frequency of Venus+ve fibres in embryos injected with different Gli/Smad combinations. Error bars indicate s.d. based on≥5° hemisegments from five different embryos. (F) Gli2aR/Smad1 co-injected with bmpr1ba morpholino: the majority of fibres in each somite are negative for Venus.