
Fig. 4
- ID
- ZDB-IMAGE-110214-58
- Genes
- Publication
- Maurya et al., 2011 - Integration of Hedgehog and BMP signalling by the engrailed2a gene in the zebrafish myotome
- All Figures
- Figures for Maurya et al., 2011
|
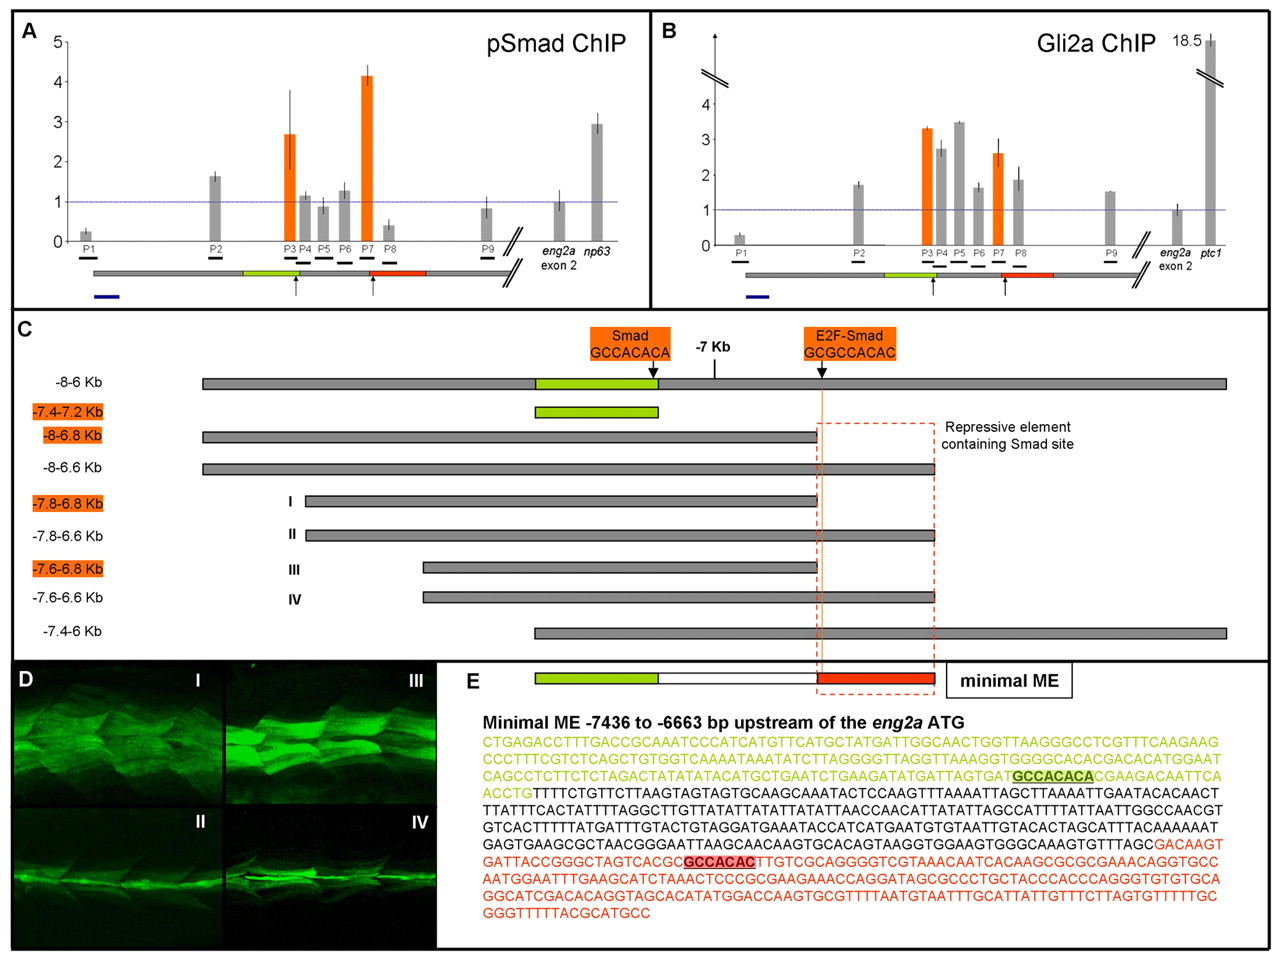
Fig. 4 Phospho-Smads and Gli2a bind the ME in the zebrafish embryo. (A) qPCR detection of DNA fragments (P1-P9) within the eng2a ME (horizontal grey bar: the regions shaded green and red correspond to the correspondingly coloured sequences shown in E) in chromatin precipitated from 14 ss embryo nuclear extracts using the pSmad antibody. Fragment sizes (bp): P1,146; P2, 119; P3, 102; P4, 120; P5, 145; P6, 124; P7, 117; P8, 117; P9, 114. The y-axis indicates fold changes normalised to a fragment within the second exon of the eng2a gene. Enrichment of a fragment upstream of the np63 transcription unit provides a positive control. Orange bars denote enrichment of fragments containing putative Smad-binding sites, indicated in C and E. Enrichments are normalised against input chromatin and also against IgG-precipitated chromatin. Error bars represent s.d. derived from qPCR repeats from the same ChIP preparation; the enrichments shown are from a single ChIP. Similar enrichments were obtained in biological repeats of ChIP preparations. (B) qPCR detection of DNA fragments (P1-P9; as described above) within the eng2a ME in chromatin precipitated from 14 ss embryo nuclear extracts using the αGli2a antibody. Enrichment of a fragment upstream of the ptc1 transcription unit serves as a positive control. (C) ME deletion constructs assayed for activity in stable transgenic lines (listed in Table 1). Fragment lengths boxed in orange indicate those that show ectopic expression. The dotted orange box indicates a putative repressor element revealed by this analysis. (D) Examples of ectopic eGFP expression in embryos from transgenic lines Tg(eng2a:eGFP)i247 (I) and Tg(eng2a:eGFP)i249 (III) and normal expression in lines Tg(eng2a:eGFP)i248 (II) and Tg(eng2a:eGFP)i250 (IV). (E) Nucleotide sequence of the eng2a minimal ME showing the two putative Smad-binding sites: the more distal of these (highlighted in green) lies in a region (shown in green) absolutely required for ME activity; the more proximal site (highlighted in red) lies in a region required for ME repression. Scale bar: 200 bp in A and B.