
|
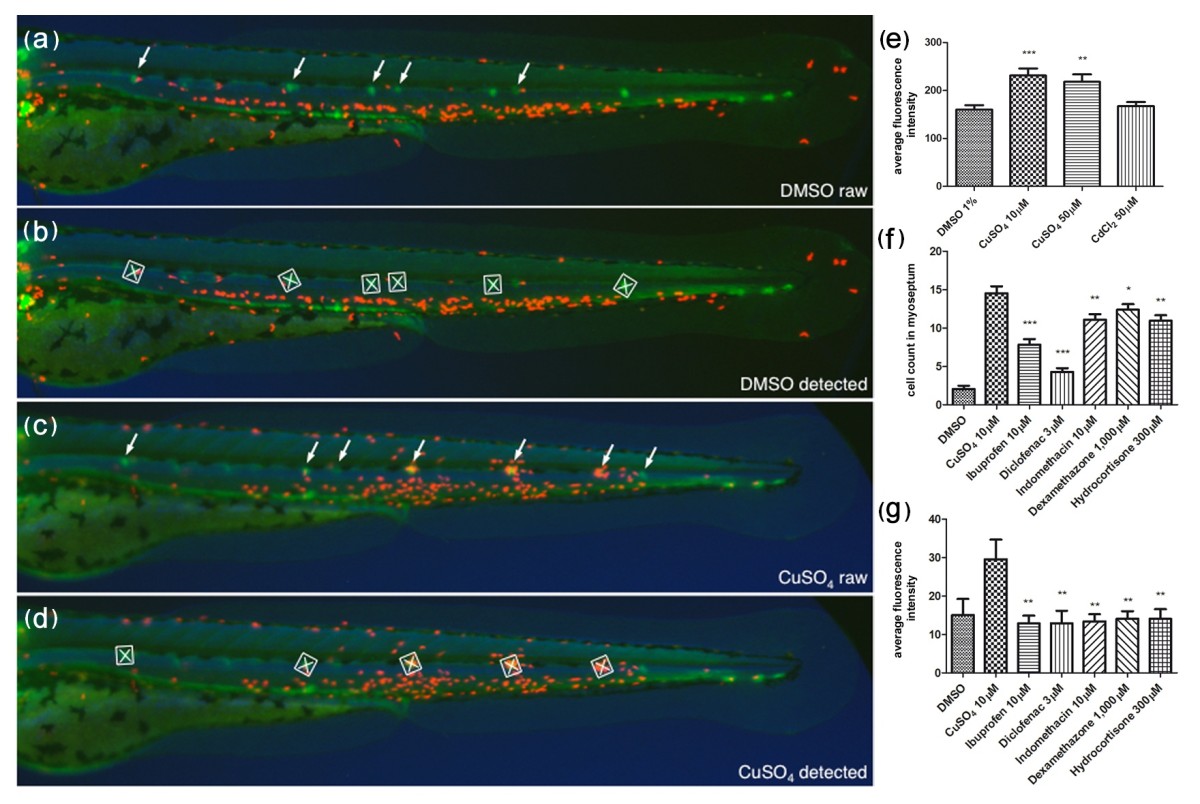
Fig. 5 Automated ChIn assay. (a-d) Image acquisition method using compound transgenic larvae cldnB::GFP and lysC::DsRED2. Images show control (DMSO) (a and b) and treated (CuSO4) (c and d) fish revealing neuromasts (green, arrows) and leukocytes (red). Shown are the raw images (a and c) and the number and identity of the neuromasts that were automatically detected by the software (b and d) (white squares). The image analysis software determines the average red fluorescence intensity per square (neuromast area) and calculates the data averaged for all squares detected within one larva. Note that the program is able to detect most, but not all, of the visible neuromasts. The variable neuromast detection success is compensated by using more larvae than in the manual method: 24 per plate, in triplicate, averaging around 50 data-producing larvae per condition. (e) A control experiment using the automated ChIn assay. Untreated or metal-exposed double-transgenic fish were imaged, and red fluorescence was averaged from three experiments. Results are comparable to manual ChIn assays. (f and g) Comparison of ChIn assay results between the manual quantification method (f) and automated detection (g) of anti-inflammatory drug activity.