
Fig. 3
- ID
- ZDB-IMAGE-110121-43
- Genes
- Antibodies
- Publication
- Zigman et al., 2011 - Zebrafish Neural Tube Morphogenesis Requires Scribble-Dependent Oriented Cell Divisions
- All Figures
- Figures for Zigman et al., 2011
|
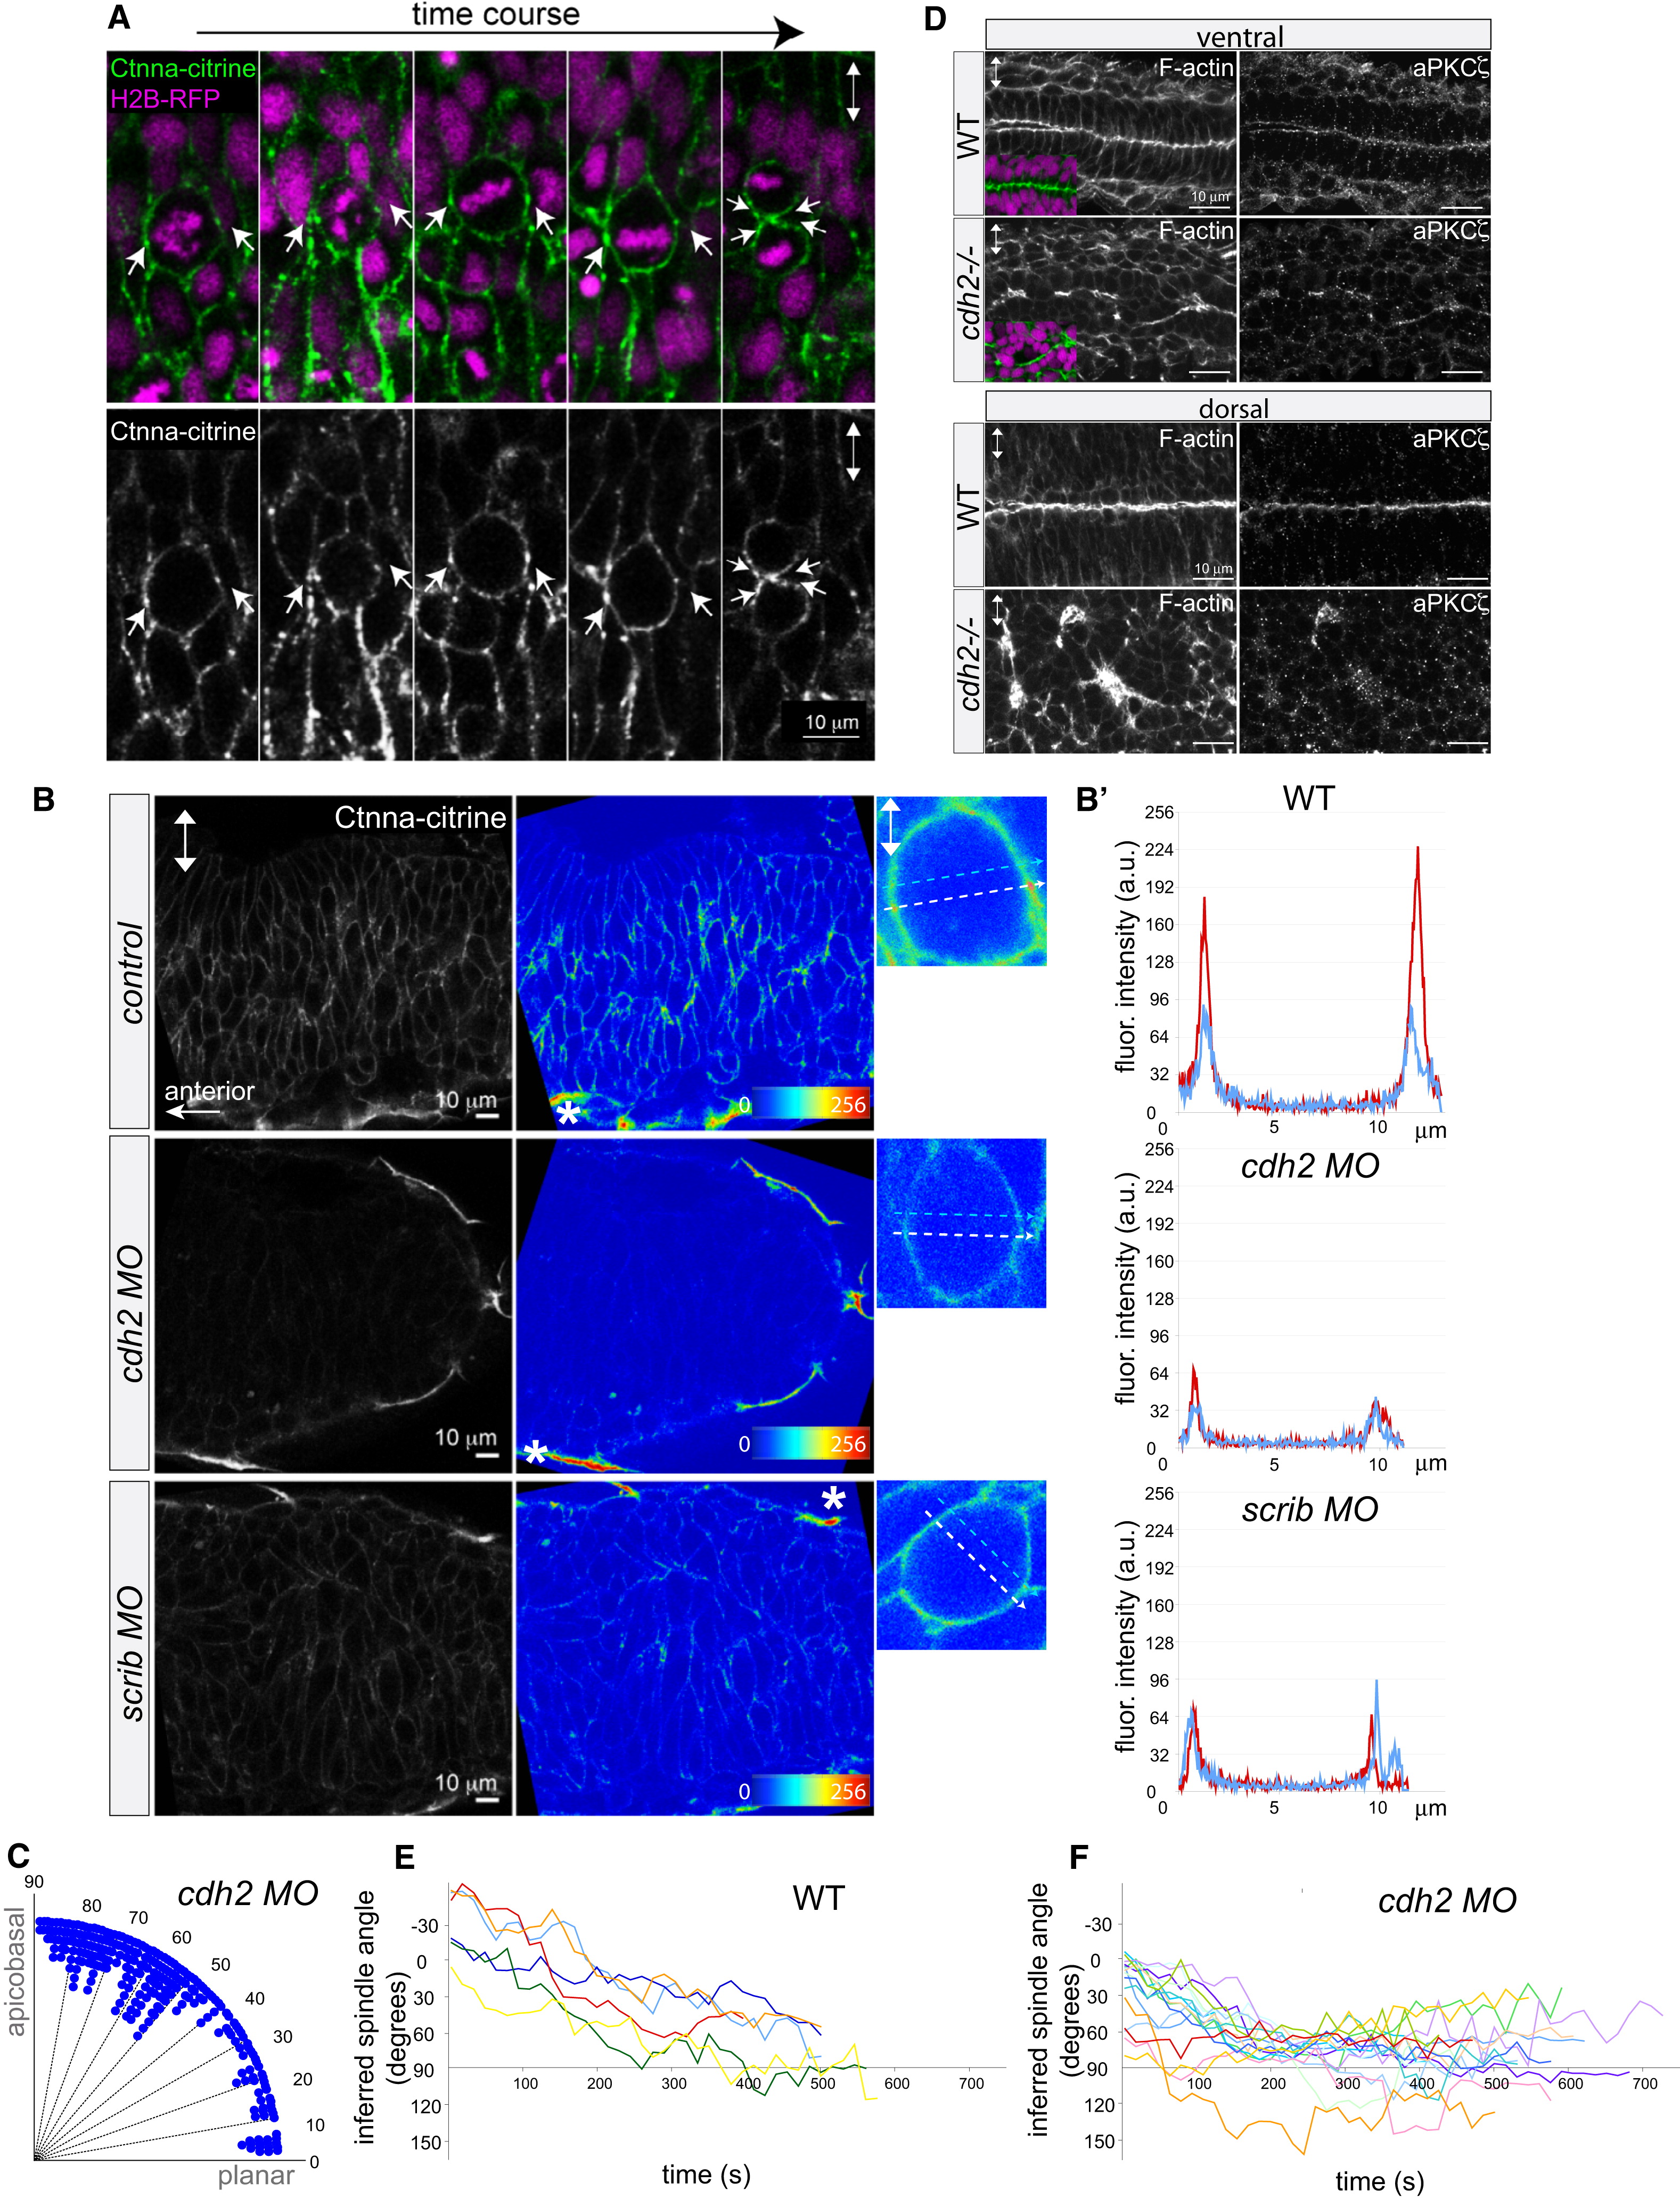
Fig. 3 Reduction of α-Catenin Foci in the Neural Keel Correlates with Aberrant Mitotic Orientation and Neural Tube Architecture Defects
(A) Equatorially positioned cortical Ctnna-citrine foci (α-catenin, green, arrows) are stationary while chromosomes (H2B-RFP, purple) rotate in a time-lapse of a dividing neural keel progenitor. Upper panel shows merge; lower panel shows Ctnna-citrine alone.
(B) Scrib and Ncad/Cdh2 are required for Ctnna-citrine abundance and the localization of equatorial cortical Ctnna-citrine foci in neural keel mitotic progenitors. Posterior hindbrain is shown at 6–8 somites with Ctnna-citrine (left column), as Ctnna-citrine fluorescence intensity in pseudocolors (middle column), and in pseudocolors of single mitotic progenitors (right column). Localization of Ctnna-citrine is shown in WT (top row), cdh2 morphants (middle row), and scrib morphants (bottom row). The unchanged Ctnna-citrine signal in nonneural peridermal cells is marked by an asterisk.
(B′) Fluorescence intensity plots of Ctnna-citrine levels in WT, cdh2 morphant, and scrib morphant mitotic cells (shown in B), with the y axis displaying arbitrary gray values along a line across a mitotic cell at equatorial (white dashed arrow in pictures; red line in plots) and lateral (faint blue dashed arrow in pictures; blue line in plots) positions averaged over 8 pixels in width.
(C) Quantification of mitosis orientation at anaphase in cdh2 morphants. This distribution is highly significantly different from WT (n = 267, χ2 = 224, 8 df; p < 0.001). For WT controls, see Figure 1C.
(D) Disorganized, branched neural tube midline in the cdh2-/- neural tube in horizontal cryosections. F-actin/phalloidin is shown in green, aPKCζ in white, and DAPI (DNA) in purple.
(E and F) Representation of mitotic spindle rotation in live WT (E; n = 6) and cdh2 morphant (F; n = 16) neural keel progenitors. Spindle orientation is inferred from the orientation of the chromosomes marked with H2B-GFP.
Images in all panels are in dorsal view. Two-way arrows indicate the apicobasal axis. See also Figure S3.