
Fig. 6
- ID
- ZDB-IMAGE-110113-6
- Publication
- Wang et al., 2011 - The Rho kinase Rock2b establishes anteroposterior asymmetry of the ciliated Kupffer's vesicle in zebrafish
- All Figures
- Figures for Wang et al., 2011
|
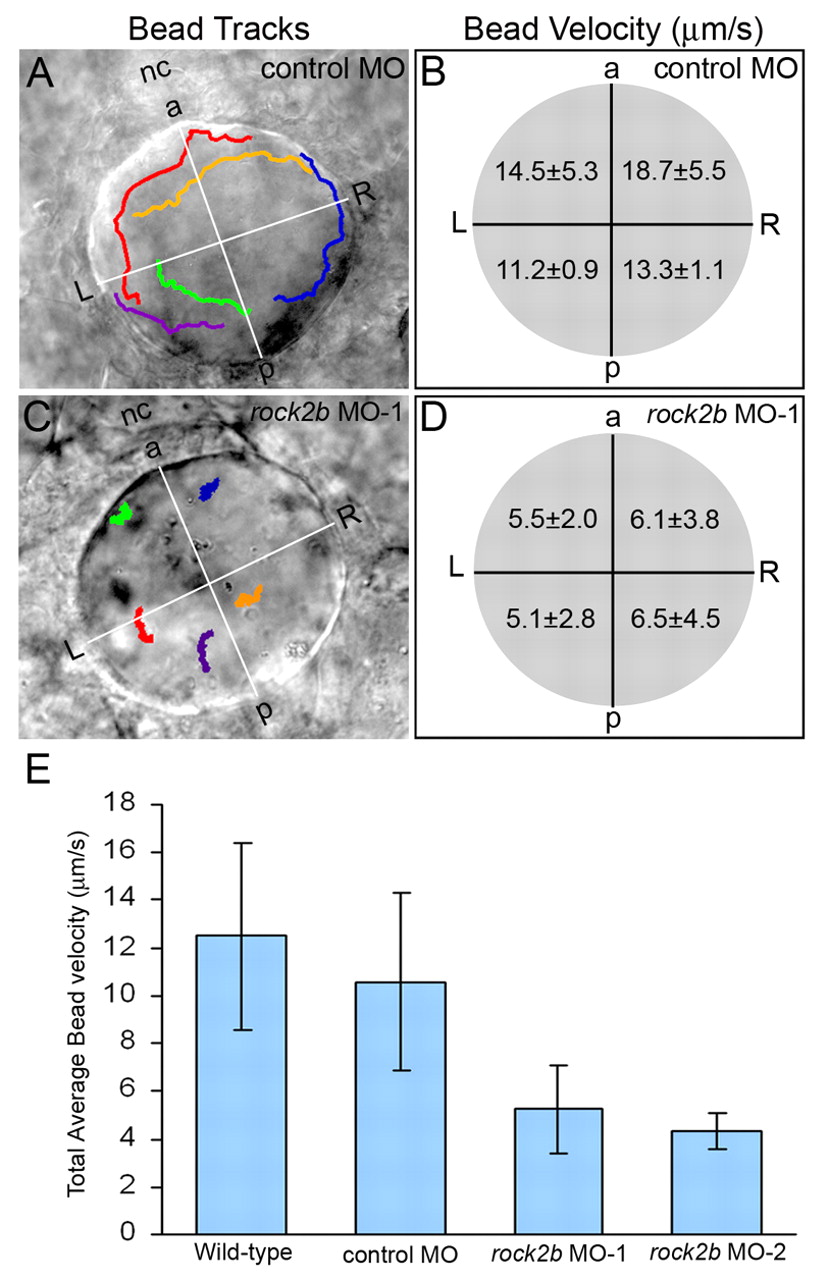
Fig. 6 Asymmetric KV fluid flow is disrupted by rock2b knockdown. (A,C) Tracks of fluorescent beads superimposed on DIC images of KV. Beads followed a counterclockwise path in control MO embryos (A), but this directional flow was lost in rock2b MO embryos (C). (B,D) Measurements of bead velocities in quadrants of KV showed that flow was stronger in the anterior region of control MO embryos (B; n=28 beads from six embryos), but velocities were similar in all quadrants of rock2b MO embryos (D; n=30 beads from seven embryos). (E) Total average flow velocity was reduced in rock2b MO embryos relative to controls. Average velocity is shown for uninjected (n=35 beads from seven embryos), control MO (n=30 beads from six embryos), rock2b MO-1 (n=70 beads from 14 embryos) and rock2b MO-2 (n=19 beads from four embryos) embryos. Error bar: 1 s.d. nc, notochord; a, anterior; p, posterior; L, left; R, right.