
Image
|
Figure Caption
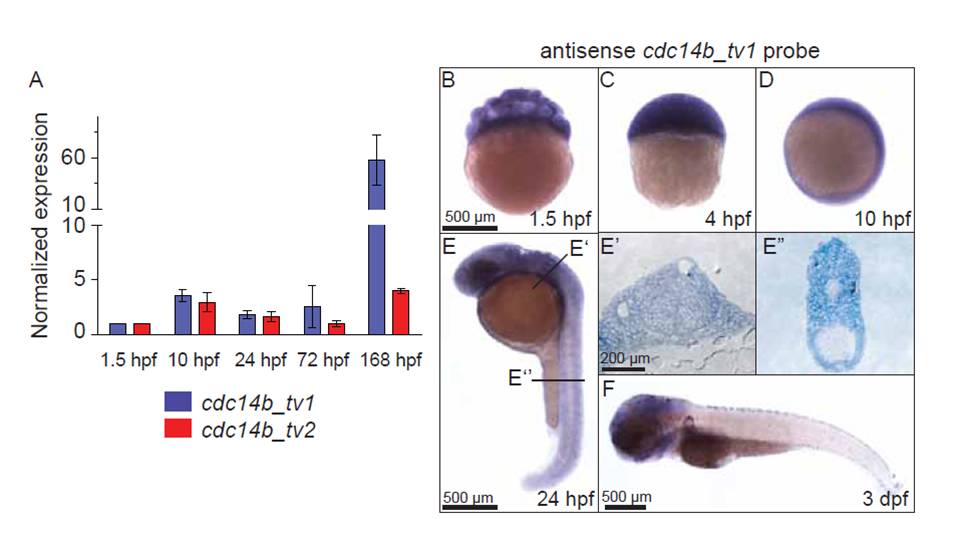
Fig. S4 Expression pattern of cdc14b. (A) Quantitative RT-PCR comparing cdc14b_tv1 and cdc14b_tv2 isoforms level of expression at specific times during embryonic and early larval development. Data are represented as mean±s.e.m. Statistics were carried out using Student′s t-test. (B-F) In situ hybridization with antisense cdc14b_tv1 probe. (E′,E′′) Sections stained with Toluidine Blue through a 24 hpf embryo at locations indicated in E.
Acknowledgments
This image is the copyrighted work of the attributed author or publisher, and
ZFIN has permission only to display this image to its users.
Additional permissions should be obtained from the applicable author or publisher of the image.
Full text @ Development