
Fig. 6
- ID
- ZDB-IMAGE-110112-32
- Publication
- Clément et al., 2011 - The Cdc14B phosphatase contributes to ciliogenesis in zebrafish
- All Figures
- Figures for Clément et al., 2011
|
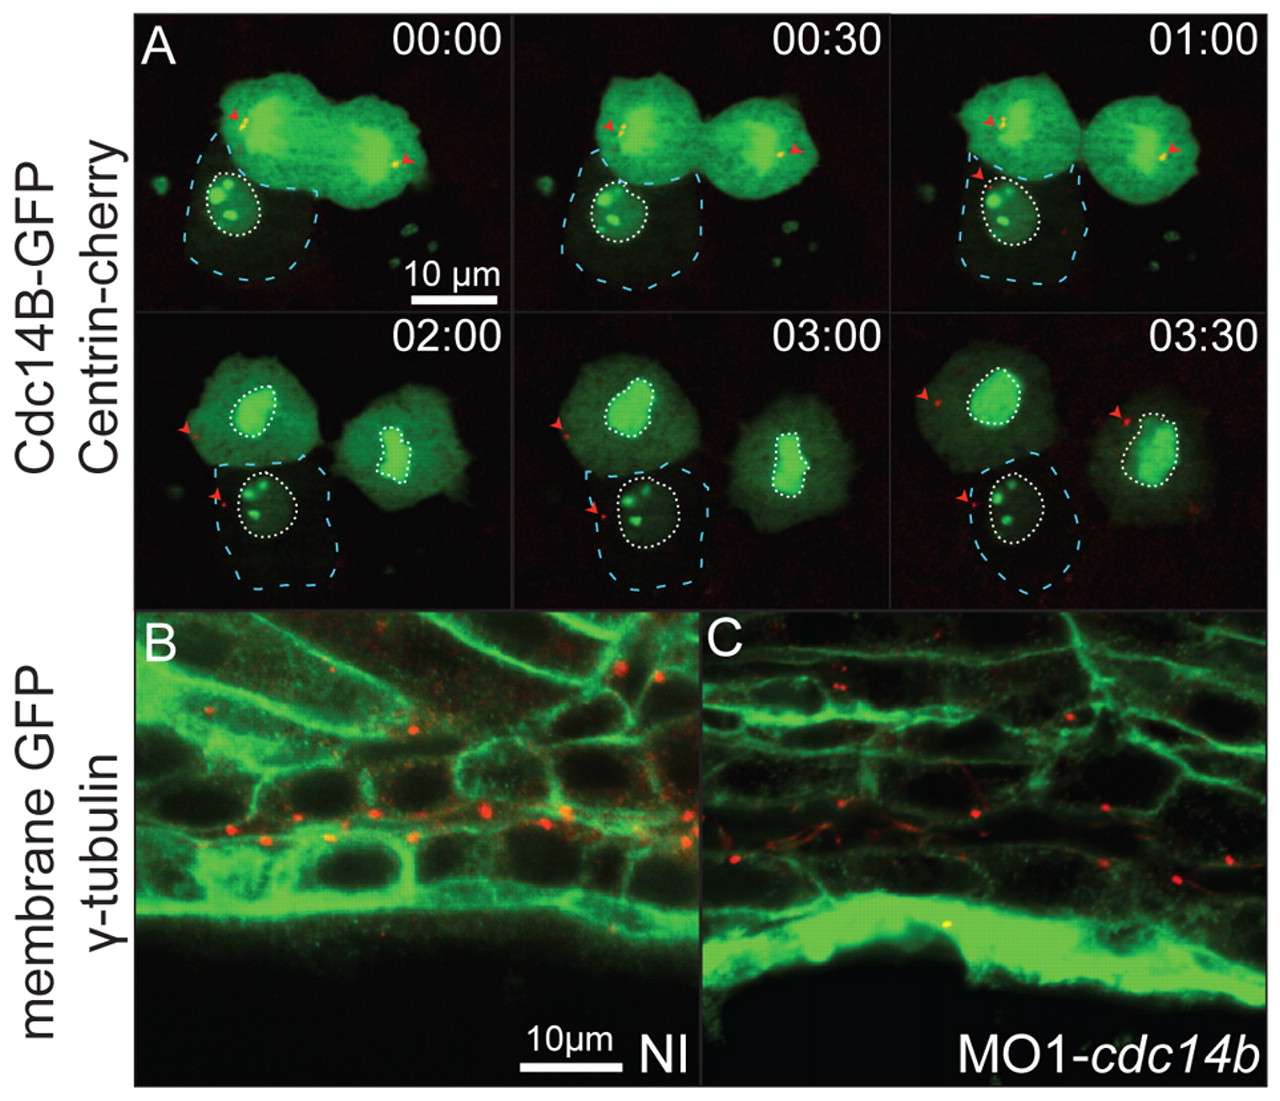
Fig. 6 Analysis of Cdc14B function during ciliogenesis. (A) Dynamic distribution of Cdc14B during cell division at 8 hpf. The embryo was injected with synthetic cdc14b_tv1-GFP (green) and centrin-cherry (red) RNAs. Dashed lines outline a cell in interphase. (Top cell) A dividing cell proceeding through anaphase (00:00-00:30), telophase (1:00-2:00) and interphase (3:00-3:30). Arrowheads indicate the centrioles. Dotted lines outline the nuclear envelope. (B,C) Positioning of the centrioles in the posterior kidney duct at 27 hpf in non-injected (B) and MO1-cdc14b-injected (C) embryos visualized with an anti-γ-tubulin antibody (red) and phalloidin (green).