
IMAGE
Fig. S4
- ID
- ZDB-IMAGE-110111-33
- Publication
- Gallardo et al., 2010 - Molecular dissection of the migrating posterior lateral line primordium during early development in zebrafish
- All Figures
- Figures for Gallardo et al., 2010
Image
|
Figure Caption
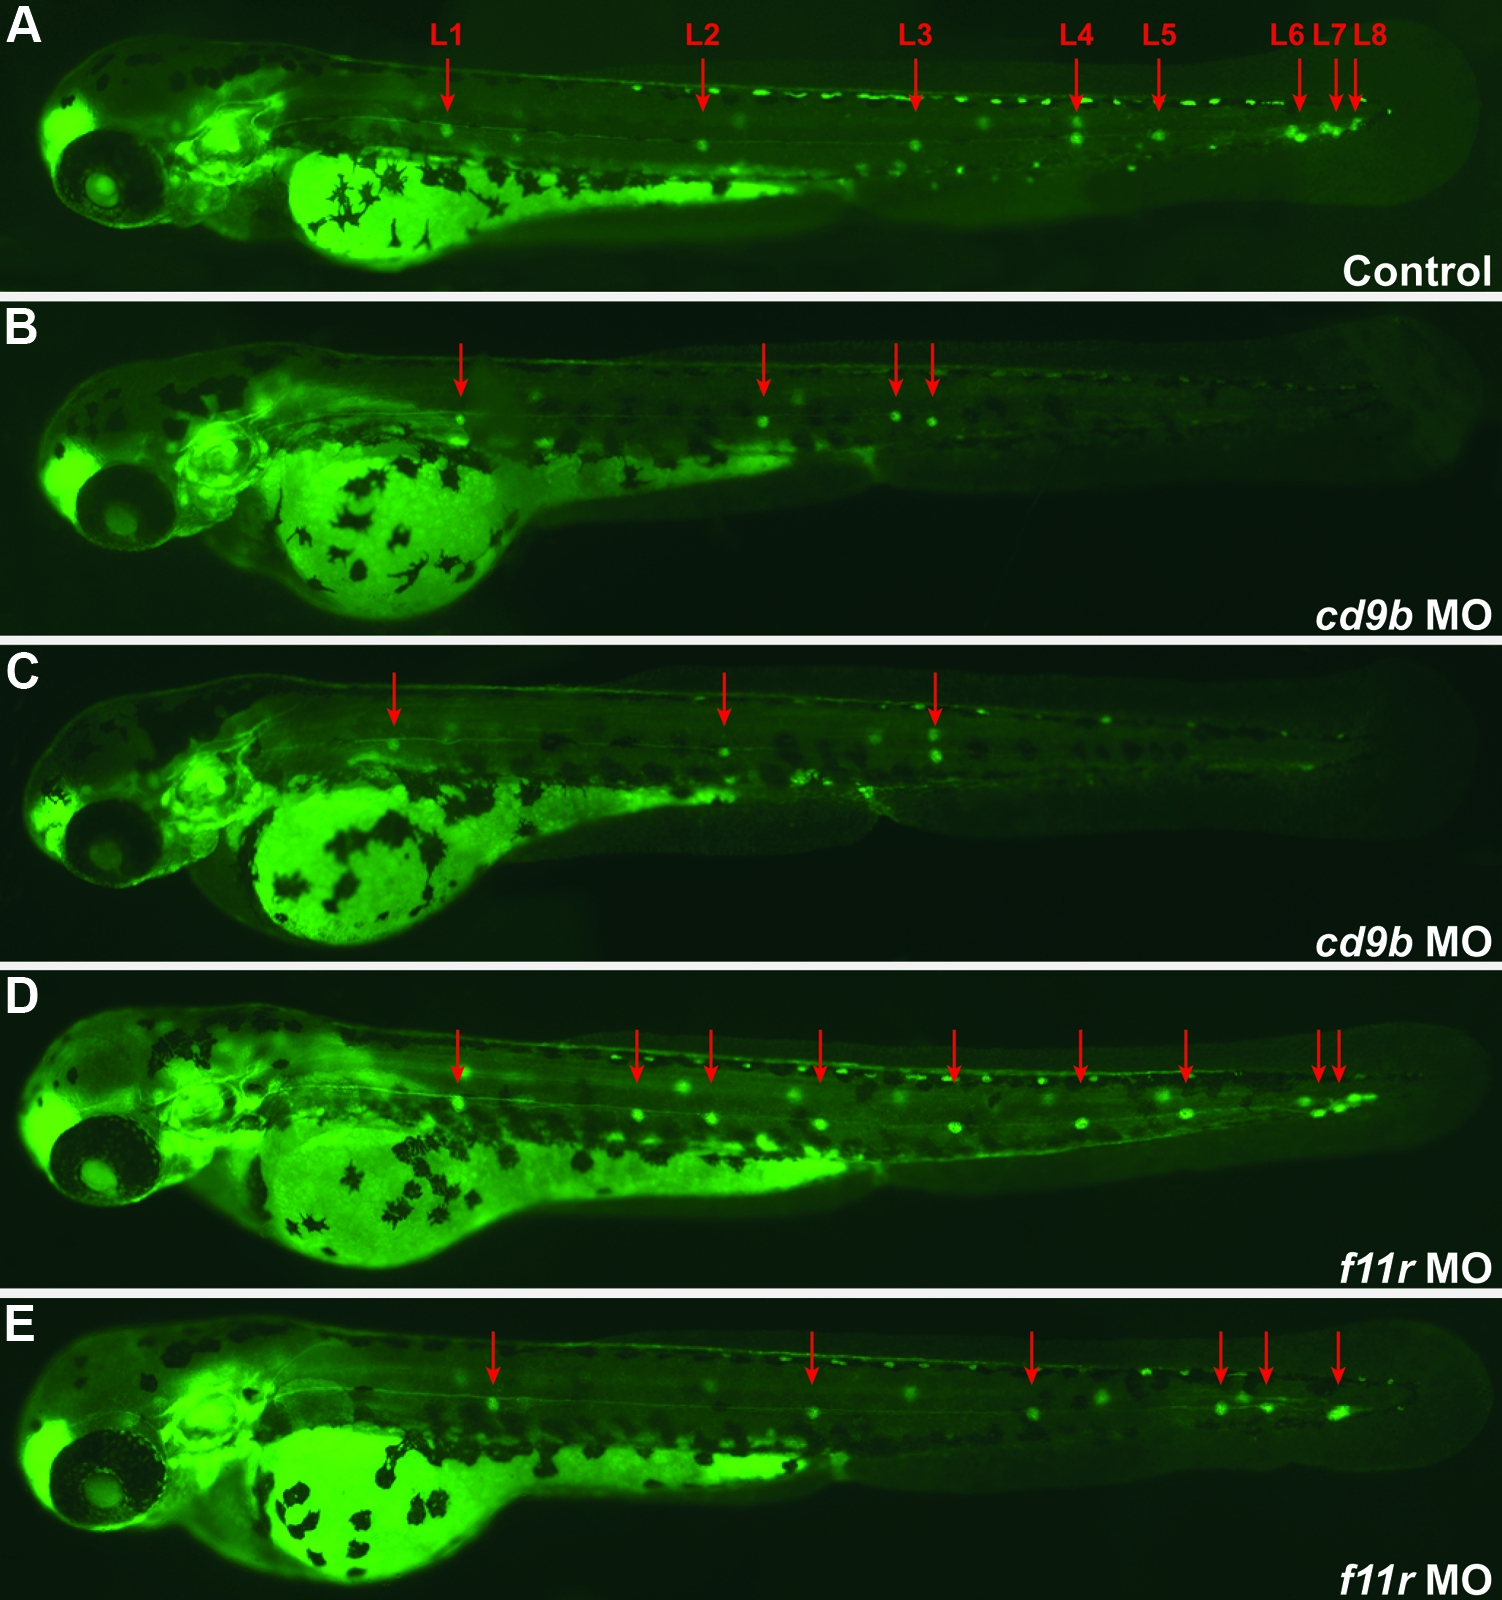
Fig. S4 Pattern of the neuromast deposition in the embryonic PLL. The number and position of the neuromasts was analyzed in control (A), cd9bMO (B-C), and f11rMO (D-E) embryos at 48 hpf. Red arrows indicate the position of the PLL neuromasts.
Figure Data
Acknowledgments
This image is the copyrighted work of the attributed author or publisher, and
ZFIN has permission only to display this image to its users.
Additional permissions should be obtained from the applicable author or publisher of the image.
Full text @ BMC Dev. Biol.