
Image
|
Figure Caption
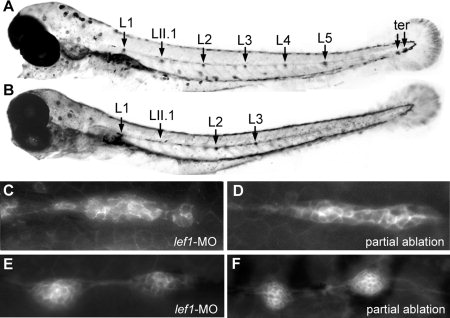
Fig. 3 Posterior lateral line (PLL) phenotype due to lef1 loss of function. A,B: Entire PLL pattern visualized by alkaline phosphatase labeling in 3 days postfertilization (dpf) control and lef1-MO embryos, respectively. C,D: Reduced primordia in lef1-MO embryos and after partial primordium ablation, respectively. E,F: Consecutive neuromasts at the end of truncated lines due to lef1 inactivation and primordium ablation, respectively. MO, morpholino oligonucleotide. Scale bars = 50 μm.
Acknowledgments
This image is the copyrighted work of the attributed author or publisher, and
ZFIN has permission only to display this image to its users.
Additional permissions should be obtained from the applicable author or publisher of the image.
Full text @ Dev. Dyn.