
|
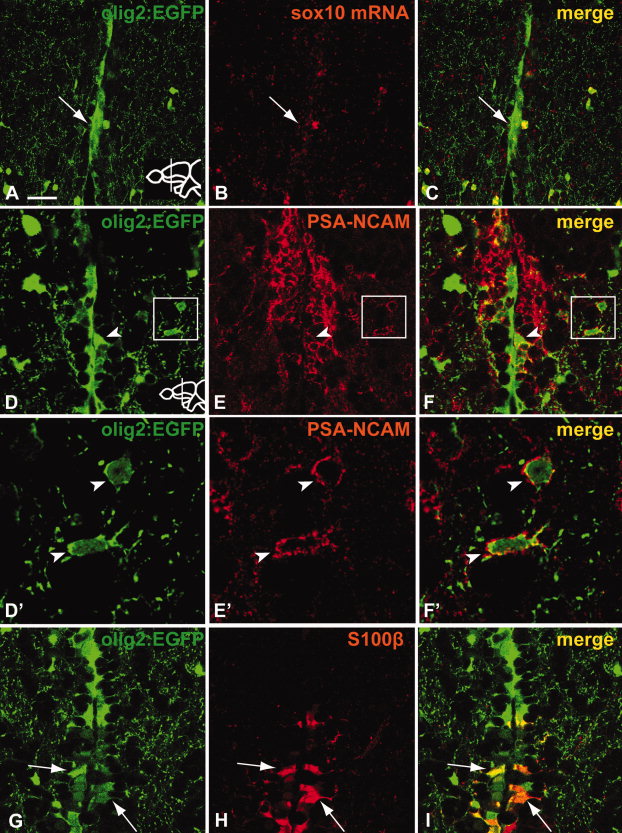
Fig. 7 Tg(olig2:EGFP)-positive cells in the RMS do not express sox10 mRNA. A subpopulation of Tg(olig2:EGFP)-positive cells in the RMS expresses PSA-NCAM. Tg(olig2:EGFP) cells ventral to the RMS co-express the radial glia marker S100β. A–C: No or weak expression of sox10 mRNA (B) in Tg(olig2:EGFP) cells (A) of the RMS as revealed by fluorescent in situ hybridization (arrow A–C). D–F: Arrowhead in D–F indicates co-expression of Tg(olig2:EGFP) and PSA-NCAM. Boxed regions are shown in high magnification in D′–F′. D′–F′: High magnification of boxed regions in D–F. In a few cases, cells lateral to the RMS were found to co-express both markers (arrowheads). G–I: Cells expressing the radial glia marker S100β (H) with radial glia-like morphologies can be observed co-expressing Tg(olig2:EGFP) (I) in a short stretch ventral to the RMS (arrows). Scale bar = (A–C) 25 μm, (D–F) 25 μm, (D′–F′) 5 μm, (G–I) 25 μm.