
|
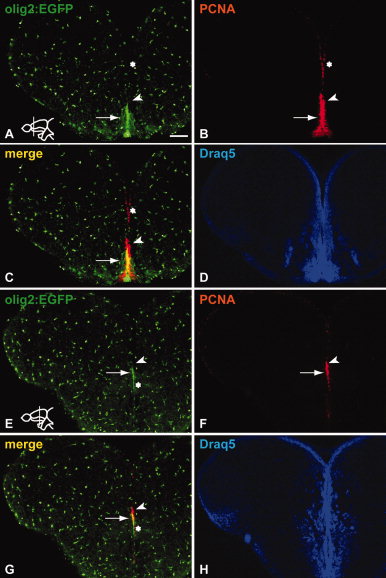
Fig. 5 Sections through the adult zebrafish telencephalon stained immunohistochemically to reveal co-expression of Tg(olig2:EGFP) and the proliferation marker PCNA. A–D: Proliferating cells at the telencephalic ventricle are mainly Tg(olig2:EGFP) negative (asterisk in A–C). In Vv, a Tg(olig2:EGFP)-positive cell cluster in the RMS co-expresses PCNA (arrow in A–C). Arrowhead in A–C points to proliferating cells dorsal to the co-labelled region, expressing PCNA only. Draq5 staining in D and H illustrates the overall organization of nuclei in the respective sections. E–H: The ventral portion of the RMS in the medial telencephalon expresses Tg(olig2:EGFP) (arrow in E–G), while the dorsal part does not, in analogy to the RMS stripe in the anterior telencephalon (arrowhead in E–G). The asterisk indicates that the expression of Tg(olig2:EGFP) at the ventricle extends ventrally from the RMS. Scale bar = 100 μm.