
Image
|
Figure Caption
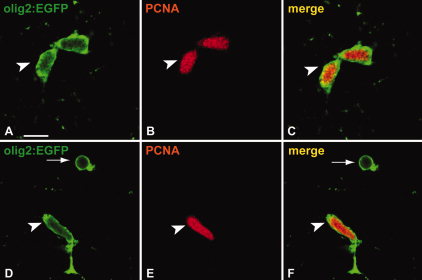
Fig. 3 A subpopulation of Tg(olig2:EGFP)-positive cells in the parenchyma are proliferating. A–C: A subpopulation of Tg(olig2:EGFP)-positive cells (A) in the brain parenchyma express PCNA (B) and can repeatedly be found as pairs (arrowhead in C; see also arrows Fig. 4). D–F: Proliferating Tg(olig2:EGFP)-positive cells (D) in the parenchyma can display elongated nuclei reminiscent of migrating cells. Arrow indicates an Tg(olig2:EGFP)-positive/PCNA negative cell (F). Scale bar = 10 μm.
Acknowledgments
This image is the copyrighted work of the attributed author or publisher, and
ZFIN has permission only to display this image to its users.
Additional permissions should be obtained from the applicable author or publisher of the image.
Full text @ Dev. Dyn.