
|
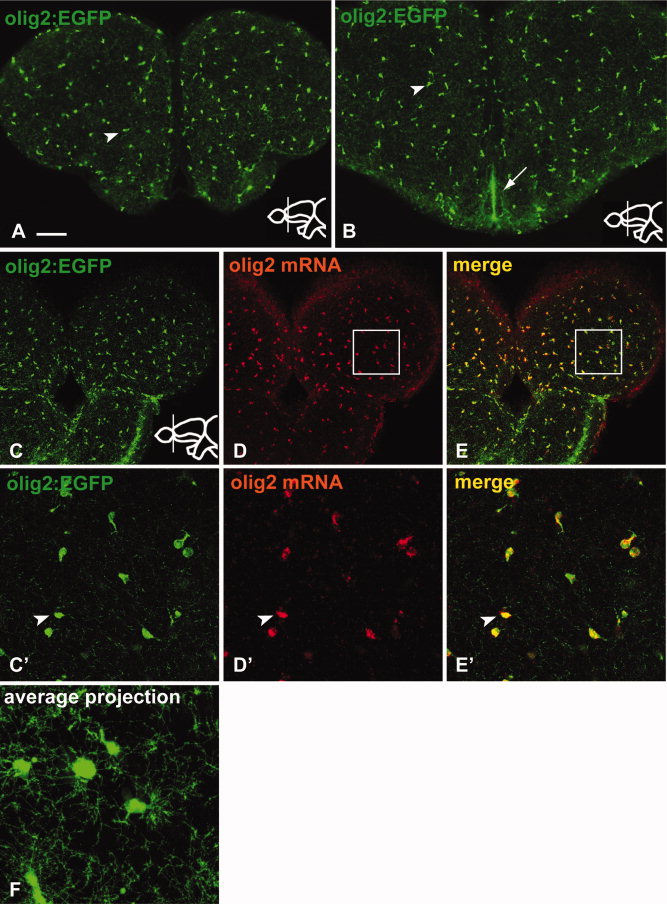
Fig. 1 The transgenic line Tg(olig2:EGFP) represents the endogenous pattern of olig2 mRNA expression in the adult telencephalon. All views of this and all other figures are transverse sections through the telencephalon, stained with the markers indicated (colour-coded). Inserts indicate rostrocaudal positions. A, B: Immunostaining against GFP in the Tg(olig2:EGFP) transgenic line. The transgenic line expresses GFP in cells of the parenchyma (arrowhead in A, B) and at the ventricle (Vv, arrow in B). C–E: The transgenic line (C) mirrors the endogenous expression of olig2 mRNA (D) shown by fluorescent in situ hybridization and confocal microscopy. A complete overlap can be observed (E). C′–E′: High magnification of the boxed region in C–E, with an arrowhead indicating co-localization of GFP and olig2 mRNA. F: Average projection of confocal Z-stack indicating the highly branched morphology of parenchymal Tg(olig2:EGFP)-expressing cells. Scale bars = (A–E) 100 μm, (C′–E′) 25 μm, (F) 10 μm.