
Fig. S3
- ID
- ZDB-IMAGE-101129-2
- Publication
- Chung et al., 2010 - Suppression of Alk8-mediated Bmp signaling cell-autonomously induces pancreatic β-cells in zebrafish
- All Figures
- Figures for Chung et al., 2010
|
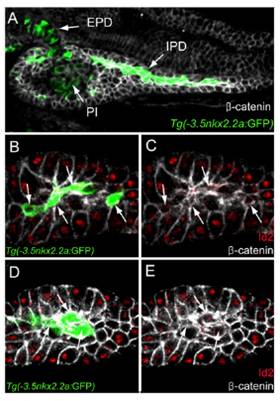
Fig. S3 Expression of Id2 is excluded from the intrapancreatic duct cells. (A) Confocal image of Tg(-3.5nkx2.2a:GFP) expression (green), which strongly marks the intrapancreatic duct (IPD) cells and weakly marks the extrapancreatic duct (EPD) cells and endocrine cells adjacent to the principal islet (PI) at 72 hpf. β-Catenin (white) outlines the general morphology of the pancreas. (B–E) Id2 (red) is expressed in acinar cells but appears to be downregulated or excluded from the intrapancreatic duct cells (green; arrows) in distal (B and C) and proximal (D and E) regions of the pancreas. For clarity, the green color is excluded in the corresponding Right panels (C and E).