
Fig. S3
- ID
- ZDB-IMAGE-101122-35
- Publication
- Soza-Ried et al., 2010 - Essential role of c-myb in definitive hematopoiesis is evolutionarily conserved
- All Figures
- Figures for Soza-Ried et al., 2010
|
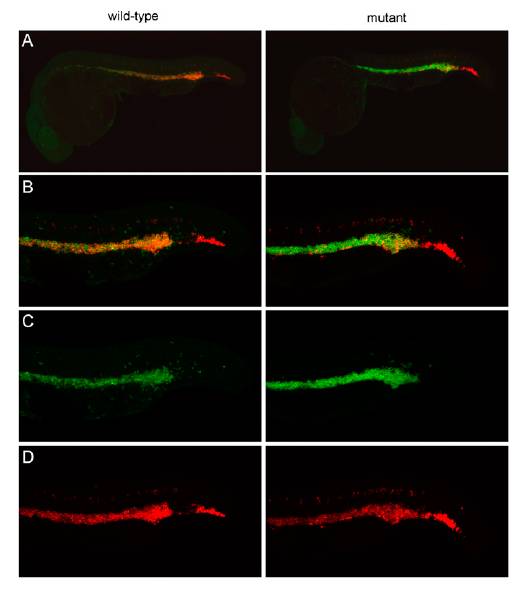
Fig. S3 Characterization of hematopoietic progenitors in embryonic c-myb mutants at 24 h postfertilization (hpf). (A) Low power view of wild-type and mutant embryos simultaneously hybridized with probes specific for scl (red fluorescence) and c-myb (green fluorescence). The photograph of the wild-type embryo is merged from 45 optical slices at 5-μm thickness; the photograph of the mutant embryo is merged from 33 slices. (B) High-power view of A, focusing on the intermediate cell mass (ICM) and posterior blood island (PBI; this panel is also shown in Fig. 3A). The photograph of the wild-type embryo is merged from 22 optical slices at 5-μm thickness; the photograph of the mutant embryo is merged from 20 slices. (C) Same as in B but presenting only c-myb signals (green), indicating that c-myb levels are increased rather than the number of c-myb positive cells. (D) Same as in B but presenting only scl signals (red).