
|
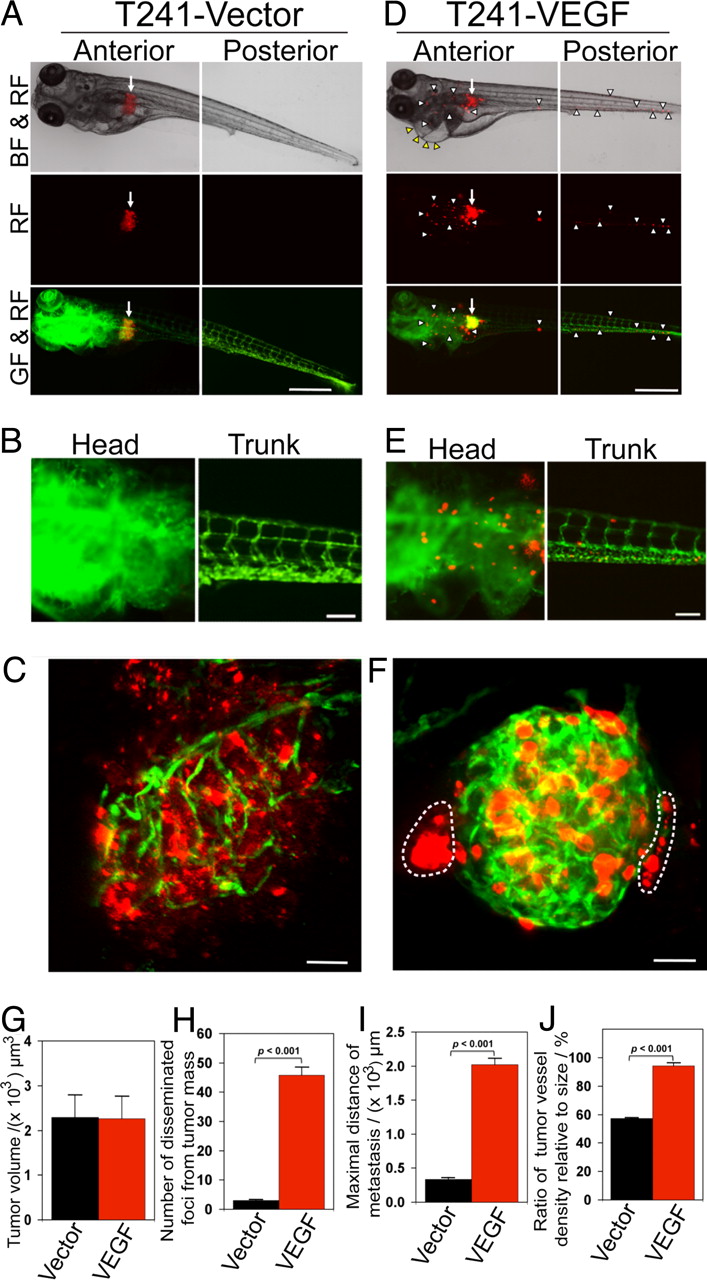
Fig. 3
Invasion, dissemination and metastasis of T241-VEGF tumors. (A and D) DiI-labeled T241-vector and T241-VEGF tumor cells were implanted in the perivitelline space and tumor cell invasion and dissemination were examined at day 6 post-injection. Arrows indicate primary tumors. Yellow arrowheads indicate pericardium edema. White arrowheads indicate disseminated tumor foci. (Scale bar, 500 μm.) (B and E) High-resolution micrographs of A and D, respectively to visualize single metastatic tumor cells. (Scale bar, 100 μm.) (C and F) Representative 3-D micrographs of confocal images of tumors (red) and tumor vasculatures (green). Dashed lines encircle invasive fronts of T241-VEGF tumors. (Scale bar, 10 μm.) (G) Quantification of tumor volume (n = 14/group). (H) Quantification of numbers of disseminated tumor foci (n = 14/group). (I) Averages of maximal distances of metastatic foci (n = 14/group). (J) Quantification of tumor vessel density relative to tumor sizes (n = 7/group). Data are represented as mean ± SEM.