
IMAGE
Fig. S3
- ID
- ZDB-IMAGE-101108-16
- Publication
- Murata et al., 2010 - Allometric growth of the trunk leads to the rostral shift of the pelvic fin in teleost fishes
- All Figures
- Figures for Murata et al., 2010
Image
|
Figure Caption
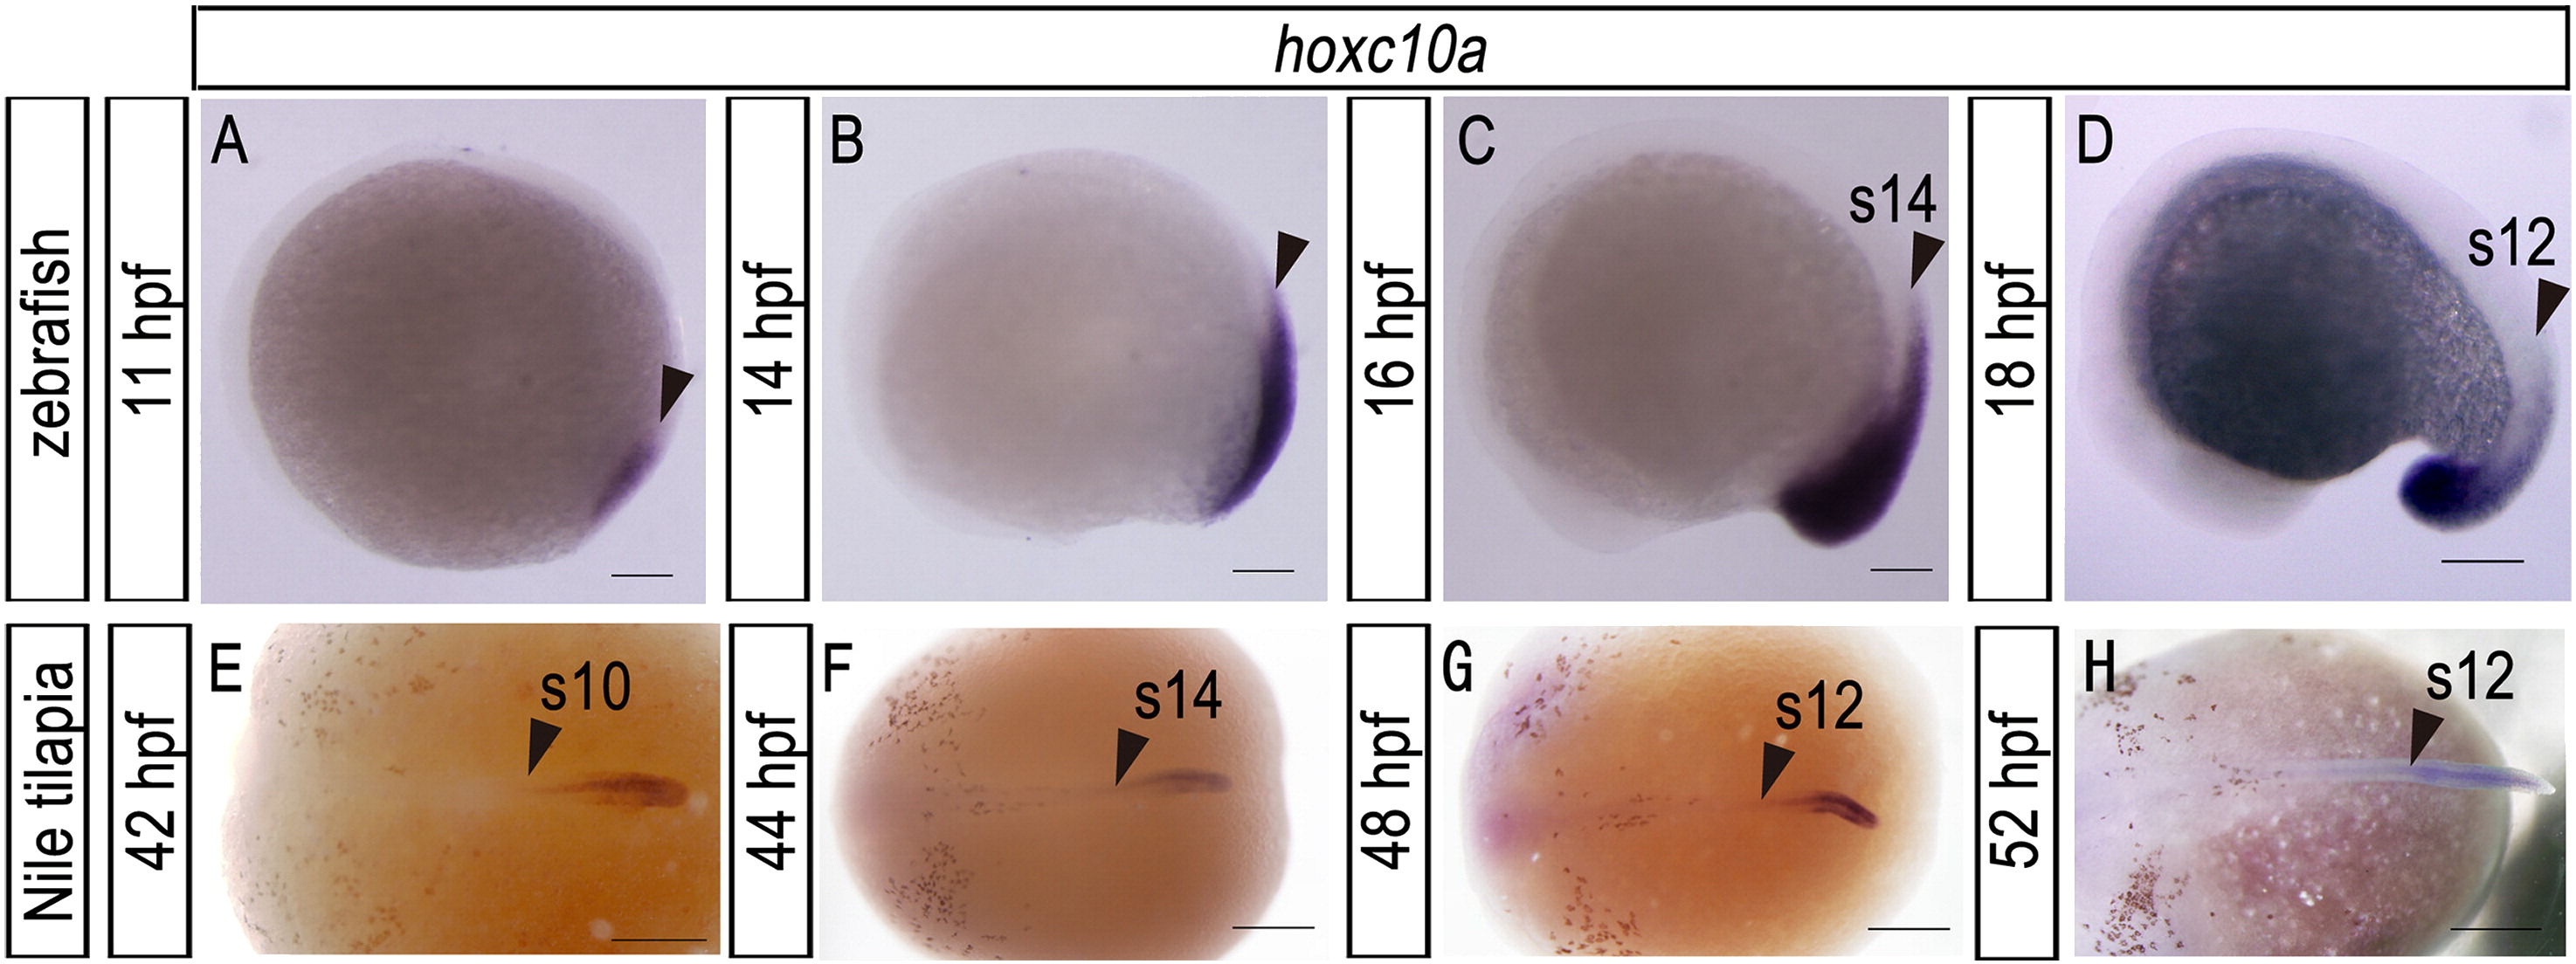
Fig. S3 Expression pattern of hoxc10a in zebrafish and Nile tilapia embryos. (A-D) Zebrafish embryos at the times indicated. (E-H) Nile tilapia embryos at the times indicated. Arrowheads indicate the anterior border of hoxc10a expression. Scale bars: 100 μm for panels (A), (B), (C), and (D); 500 μm for panels (E), (F), (G), and (H).
Acknowledgments
This image is the copyrighted work of the attributed author or publisher, and
ZFIN has permission only to display this image to its users.
Additional permissions should be obtained from the applicable author or publisher of the image.
Reprinted from Developmental Biology, 347(1), Murata, Y., Tamura, M., Aita, Y., Fujimura, K., Murakami, Y., Okabe, M., Okada, N., and Tanaka, M., Allometric growth of the trunk leads to the rostral shift of the pelvic fin in teleost fishes, 236-245, Copyright (2010) with permission from Elsevier. Full text @ Dev. Biol.