
Fig. 7
- ID
- ZDB-IMAGE-101104-47
- Publication
- Hui et al., 2010 - Cellular response after crush injury in adult zebrafish spinal cord
- All Figures
- Figures for Hui et al., 2010
|
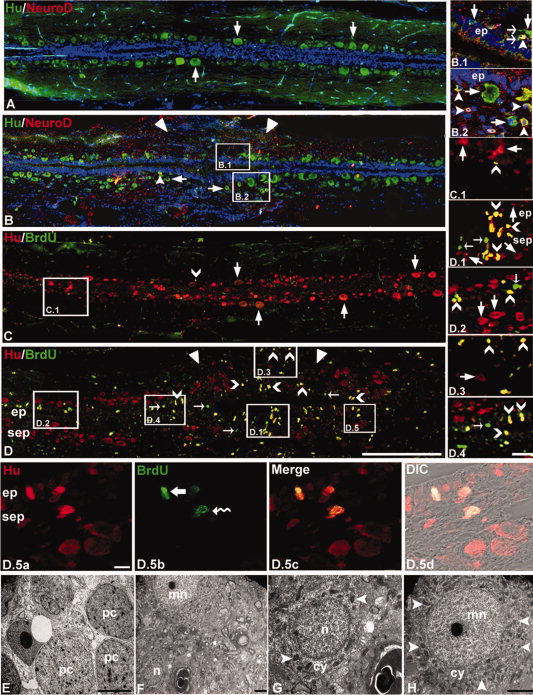
Fig. 7 Immunohistochemical localization of Hu, NeuroD, and BrdU (A-D) and ultrastructural analysis (E-H) in zebrafish spinal cord. A: Uninjured spinal cord shows the presence of many Hu+ cells (thick arrow) in subependyma, which are NeuroD-. B: The 10dpi cord section shows Hu+ cells (thick arrow) at the injured site (▼▼) and a few of these are NeuroD+ (▲). B.1, B.2: Higher magnification of indicated areas in B showing both populations of cells in the injury epicenter and the immediate adjacent part, respectively. Note that newly generated neurons extend projections (side arrow). C: Uninjured cord showing many subependymal Hu+ cells (thick arrow) and very few of them are BrdU+ (∨). C.1: At higher magnification, the same section as in C showing both Hu+/BrdU- cells (thick arrow) and Hu+/BrdU+ cell (∨). D: The 7dpi cord section shows only BrdU+ cells (→) both at the injury epicenter and in the immediate adjacent part of the epicenter. In both these regions, the number of Hu+/BrdU+ cells (∨) are higher than the normal uninjured cord and are also present close to the pial membrane at the injured site (▼▼). D.1-D.4: Same as D at higher magnification showing the presence of Hu+/BrdU+ (∨), Hu+/BrdU- thick arrow), and Hu-/BrdU+ (thin arrow) cells in the injury epicenter (D.1), adjacent normal part (D.2), subpial location (D.3), and the immediate adjacent part of epicenter (D.4) respectively. D.5: Represent the presence of both slow (bold arrow) and fast (squiggly arrow) population (D.5b) of Hu+ cells in both ependyma (ep) and subependyma (sep) (D.5a) and their respective merge (D.5c) and DIC (D.5d). E: 10dpi cord showing dividing neuronal progenitor cells (pc) at the injury site. F: One-month post-injured cord shows the presence of both newly formed neuron (n) and specified motor neuron (mn). G: Higher magnification picture of newly formed neuron (n) with a small cytoplasmic area (cy) and a few cytoplasmic organelles (white arrowhead). H: Higher magnification picture of specified motor neuron with a large volume of cytoplasm and many cytoplasmic organelles (white arrowhead). Scale bar = 200 μm (A-D), 20 μm (B.1-D.3), 10 μm (D.4), 2 μm (E-H).