
Fig. 2
- ID
- ZDB-IMAGE-101104-44
- Publication
- Hui et al., 2010 - Cellular response after crush injury in adult zebrafish spinal cord
- All Figures
- Figures for Hui et al., 2010
|
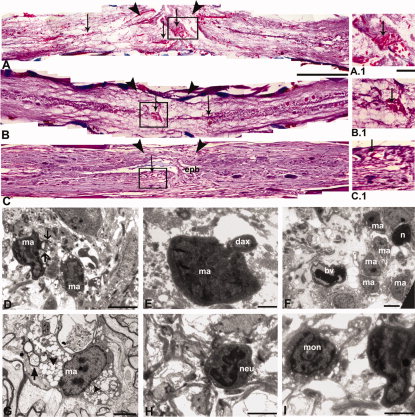
Fig. 2 Trichrome staining (A-C) and ultrastructural analysis (D-I) of injured zebrafish spinal cord. A: 1dpi cord shows infiltration of large number of RBC (↓) both at the injury epicenter (double arrowheads) and also towards the normal part of the cord. B: A 3dpi cord showing less number of infiltrating R.B.C. C: A 5dpi cord shows presence of very few blood cells and the appearance of ependymal bulb (epb) at the injury epicenter. A.1, B.1, C.1: Higher magnification representation of A, B, and C, respectively, showing the presence of blood cells at the injury epicenter. D-G: Presence of macrophages (ma) at the injury epicenter in 3dpi (D-F) and 10dpi (G) cord. D, E: Macrophage (ma) with a typical phagocytic process (↑) and in close proximity to a demyelinating axon (dax), respectively. F: A dying neuron (n) with condensed nuclear matter surrounded by infiltrated macrophages (ma) and a blood vessel (bv) nearby. G: Macrophage (ma) with many lipophillic vacuoles (►) and phagocytosed myelin debris (thick arrow). H, I: The presence of neutrophils (neu) and monocytes (mon), respectively, in 3dpi cord. Scale bar = 250 μm (A-C), 50 μm (A.1-C.1), 5 μm (D, F), 2 μm (H, I), 1 μm (E, G).