
Fig. 1
- ID
- ZDB-IMAGE-101104-43
- Publication
- Hui et al., 2010 - Cellular response after crush injury in adult zebrafish spinal cord
- All Figures
- Figures for Hui et al., 2010
|
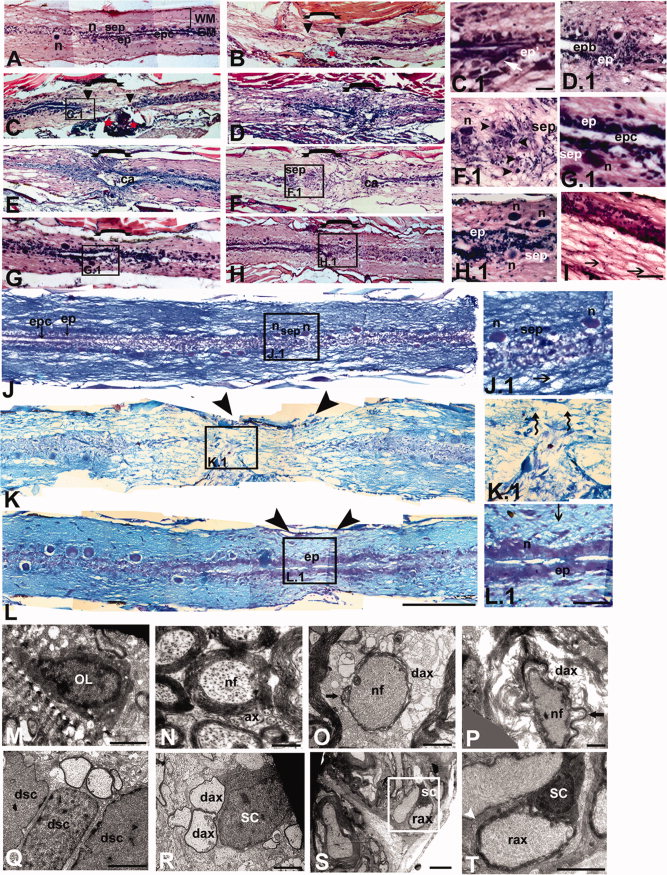
Fig. 1 Longitudinal sections of normal uninjured (A, J) and injured (B–H and K–L) zebrafish spinal cord after H&E (A–H) and luxol fast blue/cresyl violet staining (J–L). A, J: Uninjured spinal cord section shows the presence of white matter (WM), grey matter (GM), neurons (n) in the subependyma (sep), and ependyma (ep) with ependymal canal (epc). J.1: The higher magnification of J shows an axon (→) in white matter and neurons (n) in the subependyma (sep). B: 1dpi-section of spinal cord showing loss of both white and grey matter, infiltration of blood cells (red *), and disrupted ependyma (▼▼) at the injury epicenter ([bracket]). C, K: 3dpi cord shows blood clot at the site of injury (**) and same section at higher magnification (C.1) showing initiation of sealing of ependymal canal (ep2) and migrating ependymal cell (white arrow). Another section of 3dpi cord (K) showing severed ependyma, axonal loss (spiral arrow) and neuronal loss at the injury epicenter (double arrowheads). K.1: Higher magnification of K. D: 5dpi cord reveals accumulation of cells at epicenter and tissue edema. Another 5`dpi cord at higher magnification (D.1) shows complete sealing of ependyma (ep′) and formation of ependymal bulb (epb). E: Section of 7dpi cord reveals accumulation of cells at the injury epicenter, swelling of tissue, and also the presence of a continuous cavity like structure (ca) surrounded by ependymal cells. F: 10dpi cord showing the presence of a smaller cavity (ca) -like structure continuous with regenerating ependymal canal. F.1: Same cord at higher magnification, showing the presence of many newly formed cells (►) and a mature neuron (n) in the injury epicenter. G: Representative section of 15dpi cord reveals a normal regenerated ependyma with complete absence of a cavity-like structure and partially regenerated white matter. G.1: Higher magnification of the same section shows well-formed ependyma (ep) with an ependymal canal (epc) and regenerated neuron (n) in subependyma (sep). H, L: One-month regenerated cord shows both grey and white matter regeneration and both neurons (n) and axons (→) are clearly visible at the injury epicenter at higher magnification (H.1, I). Another section (L) showing regeneration of both white matter and grey matter at the injury epicenter and the same cord at higher magnification (L.1) showing small neuronal cell bodies (n), reconnected axons (↓), and compact ependyma (ep). M, N: Oligodendrocyte (OL) and myelinated axon (ax), with sparsely distributed neurofilaments (nf) within the axonal body in uninjured cord, respectively. O-P: Representative picture of demyelinating axons (dax) at the injury epicenter of 3dpi cord showing denuded axon (bold arrow) and axonal body with dense neurofilaments (nf). Q,R: 10dpi cord showing dividing Schwann cells (dsc) and Schwann cells (SC) associated with demyelinated axons (dax) at the injury epicenter, respectively. S: Remyelinating axon (rax) with Schwann cells (SC) in regenerating cord 1 month post-injury. T: Higher magnification of indicated area in S showing the basal membrane of Schwann cells (white arrowhead) around the remyelinating axon (rax). Scale bar = 400 μm (A-H), 20 μm (C.1), 40 μm (D.1-I), 200 μm (J-L), 60 μm (J.1–L.1), 2 μm (M–T).