
|
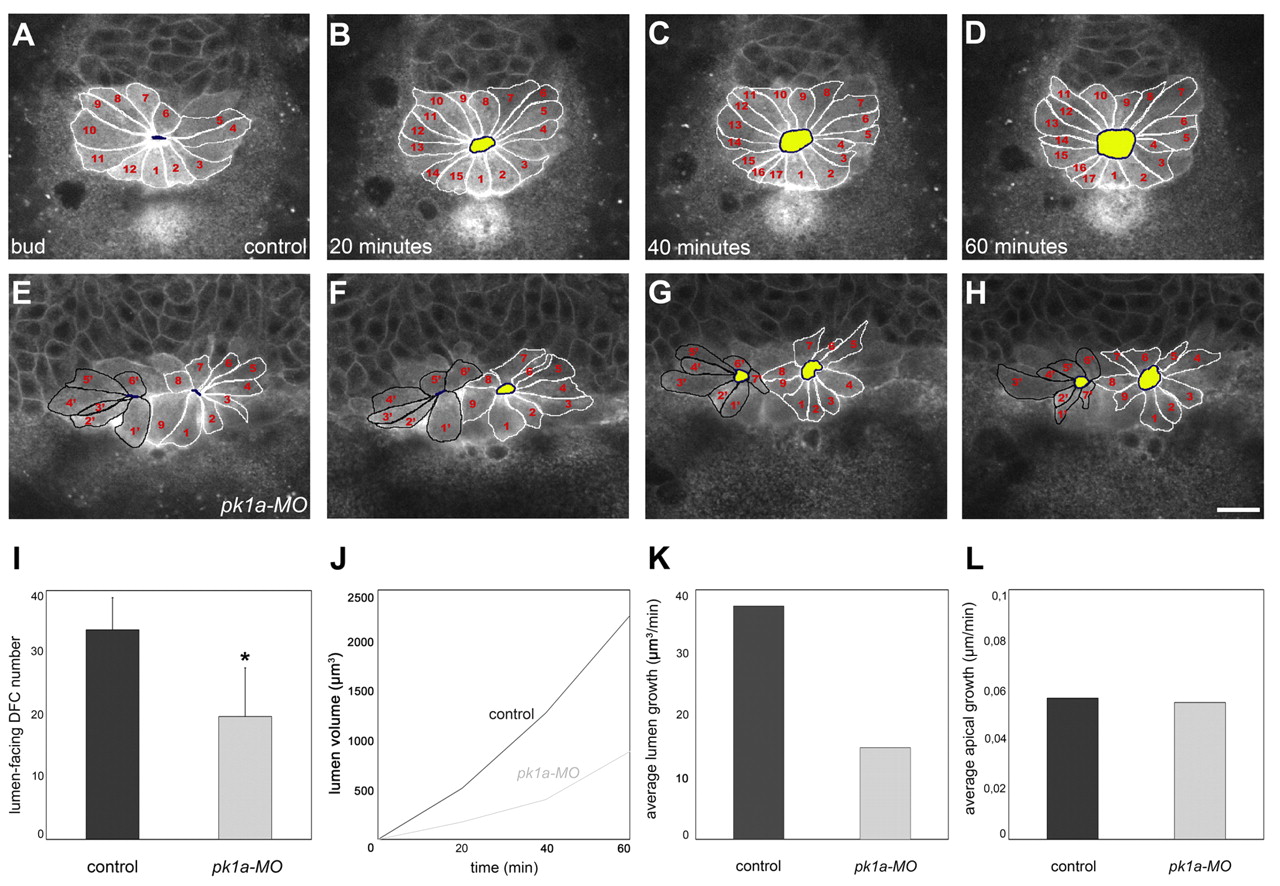
Fig. 5 Pk1a regulates KV lumen formation and expansion. (A-H) Live imaging of KV lumen formation in control and pk1a-MO zebrafish embryos coexpressing sox17::GFP and β-actin::HRAS-EGFP. Single focal planes at the centre of the DFC cluster are shown, beginning at the tailbud stage and followed every 20 minutes as indicated. Anterior is to the top. Each lumen-forming DFC is outlined and numbered. DFC apical sides are outlined in blue and the lumen is highlighted in yellow. (I) Graphic representation of lumen-forming DFC number in control and pk1a-MO embryos (mean ± s.d.; n=6 control and 7 pk1a-MO embryos; *, P<0.01, Student′s t-test) obtained from nuclei-stained Tg(sox17::GFP) embryos. (J) Graphic representation of lumen expansion during early KV formation as measured in Tg(sox17::GFP;β-actin::HRAS-EGFP) embryos. Approximate volume for control (n=2 movies) and pk1a-MO (n=2 movies) embryos was determined based on the three main axes of the ellipsoid lumen at different time-points. The start point was set at lumen opening. For fragmented lumina, volume was computed as the sum. (K) Graphic representation of the average rate of lumen growth (final volume/total time) based on the data presented in J. (L) Graphic representation of lumen-facing DFC average rate of apical growth [(final lumen circumference/final number of lumen-forming DFCs)/total time] measured in Tg(sox17::GFP;β-actin::HRAS-EGFP) embryos. Scale bar: 20 μm.