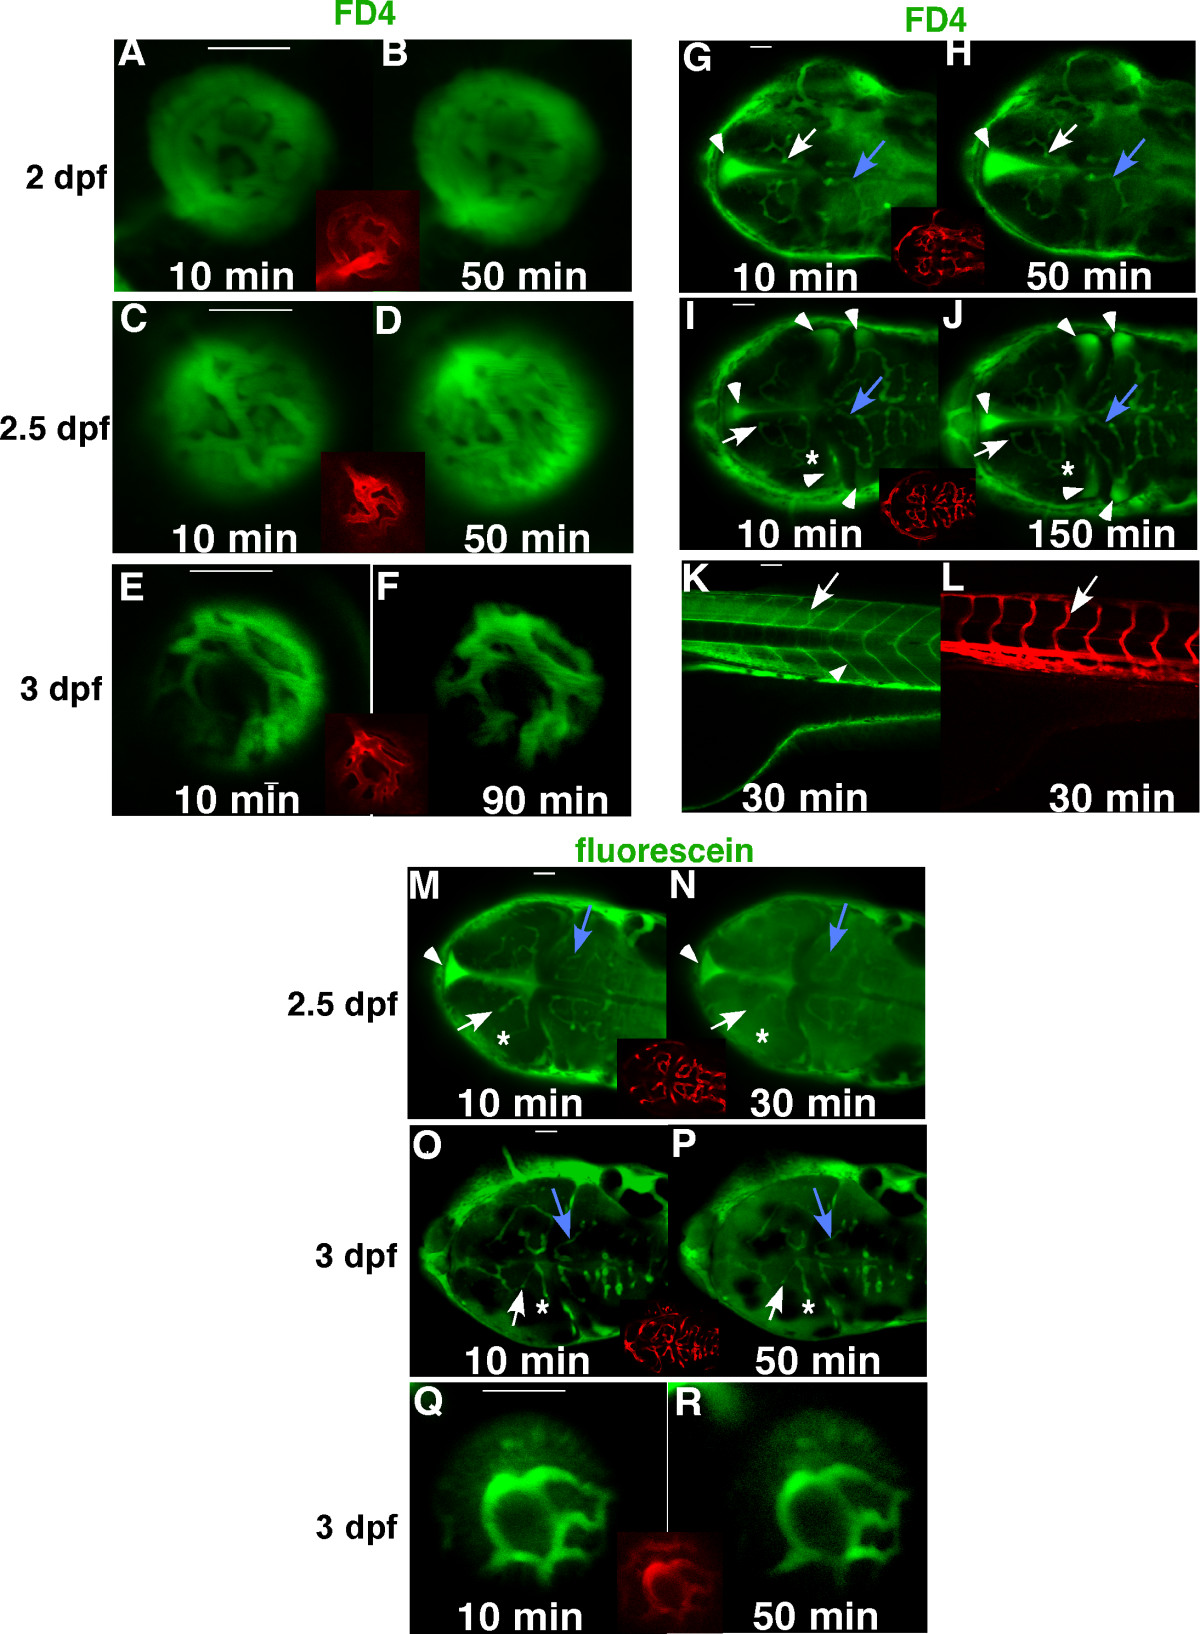
Fig. 1 Development of the BRB and BBB in zebrafish. FD4 (4,000 Da, green) was injected to the sinus venosus of Tg(flk1:mCherry) embryos at 2 dpf (A, B, G, H), 2.5 dpf (C, D, I, J) and 3 dpf (E, F, K. L). Live confocal images of the hyaloid vessels (A-F, side view), brain vessels (G-J, dorsal view) and trunk vessels (K-L, side view) were obtained from 10 to 150 minutes after injection. Insets and panel L are images of established vasculature of the injected embryos (red). In the brain, boundaries of the middle mesencephalic central artery (MMCtA) are indicated by arrows in G-J, cerebellar central artery (CCtA), by blue arrows in G-J and posterior mesencephalic central artery (PMCtA) by asterisks in I&J. Arrows in K&L indicate intersegmental vessels and arrowhead in K shows the myotomal boundaries. A small molecule, fluorescein (376 Da, green), was also used as a tracer in the injection assay (M-R). In the 2.5 dpf embryos (M&N), the PMCtA (asterisk) could not be differentiated, and boundaries of MMCtA (arrows) and CCtA (blue arrows) were enlarged and became blurred 30 minutes after injection. However in the 3 dpf embryos injected with fluorescein (O-R), boundaries of the MMCtA (arrows), PMCtA (asterisk), CCtA (blue arrows) and the hyaloid vessels (Q&R) remained sharp and clear after 50 minutes of injection. The leaked FD4 accumulated mostly in brain ventricles (arrowheads in G-J). In contrast, most of the leaked fluorescein did not accumulated in the brain ventricle (arrowheads in M&N), but evenly diffused throughout the brain (M-P). Scale bars: 50 μm.
Image
Figure Caption
Acknowledgments
This image is the copyrighted work of the attributed author or publisher, and
ZFIN has permission only to display this image to its users.
Additional permissions should be obtained from the applicable author or publisher of the image.
Full text @ BMC Dev. Biol.

