
Fig. S7
- ID
- ZDB-IMAGE-100806-171
- Publication
- Herrgen et al., 2010 - Intercellular Coupling Regulates the Period of the Segmentation Clock
- All Figures
- Figures for Herrgen et al., 2010
|
Fig. S7
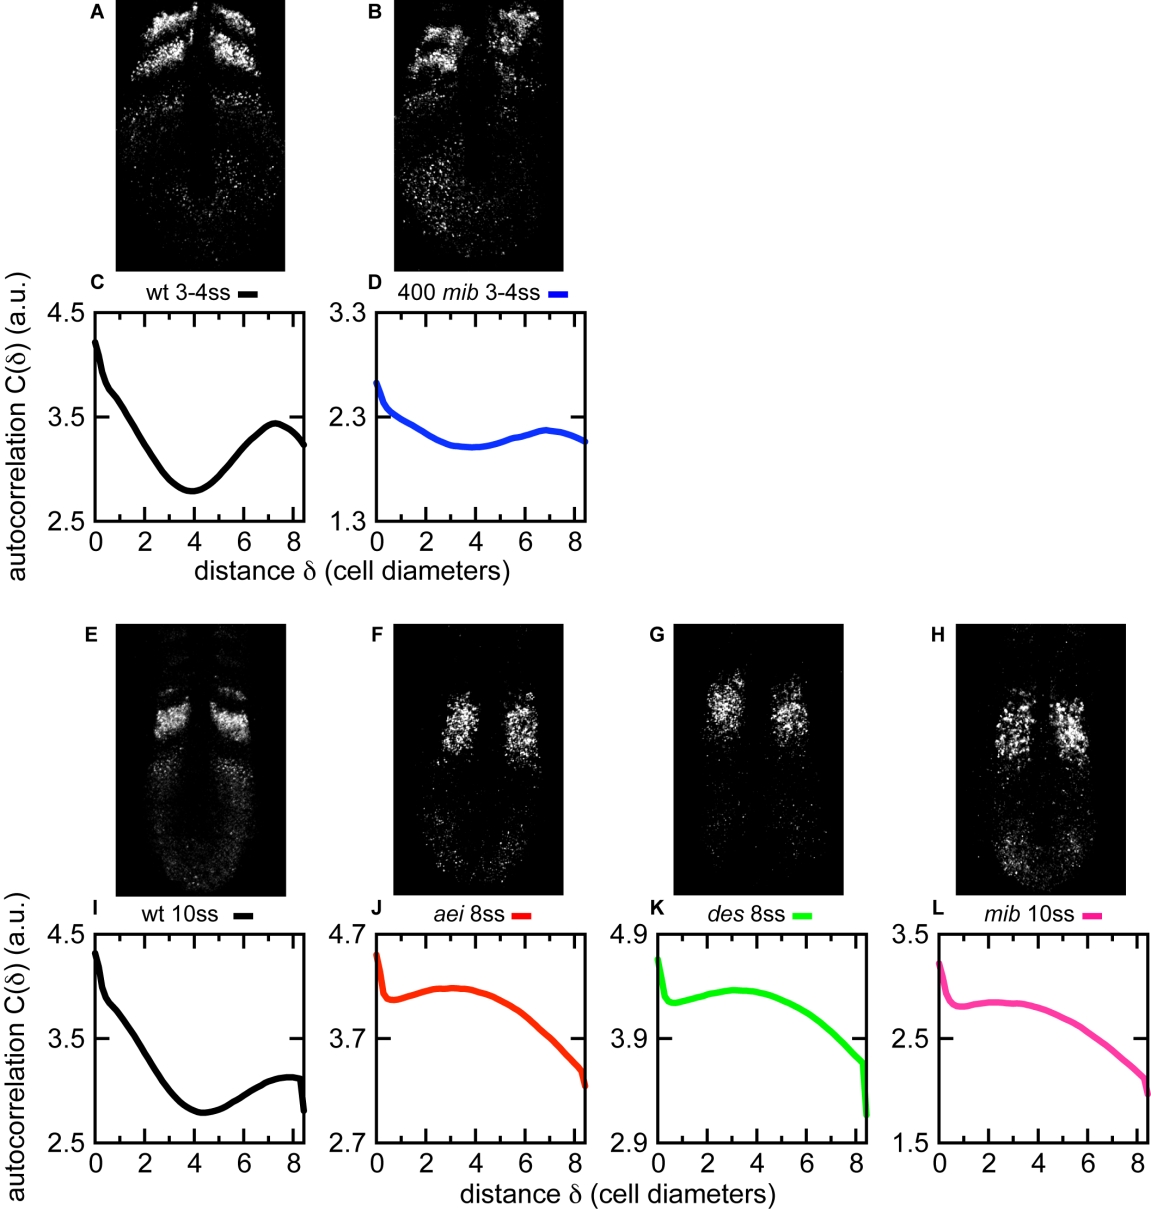
Cyclic gene expression patterns resulting from elevated Mib levels are distinct from loss of coupling mutants
Spatial organization of oscillating deltaC expression in the PSM of representative embryos shown for (A) wildtype at 3-4 ss, (B) 400 pg mib mRNA at 3-4 ss, (E) wildtype at 10 ss, and the loss of coupling mutants (F) after eight (aei/deltaD) at 8 ss, (G) deadly seven (des/notch1a) at 8 ss, and (H) mind bomb (mib) at 10 ss. Corresponding average autocorrelation functions of oscillatory gene expression patterns in the anterior PSM of (C) wildtype at 3-4 ss (n=15), (D) Mib over-expression (n=8), (I) wildtype at 10 ss (n=13), (J) aei/deltaD (n=38), (K) des/notch1a (n=36), (L) mib (n=26). The arbitrary units in the correlation axis are multiplied by 10-3. The left/right asymmetry of the pattern in Fig. S7B reflects the asymmetric distribution of the injected mRNA. Autocorrelation functions were always calculated from the most strongly affected side.