
IMAGE
Fig. S3
- ID
- ZDB-IMAGE-100723-20
- Publication
- Iida et al., 2010 - Metalloprotease-dependent onset of blood circulation in zebrafish
- All Figures
- Figures for Iida et al., 2010
Image
|
Figure Caption
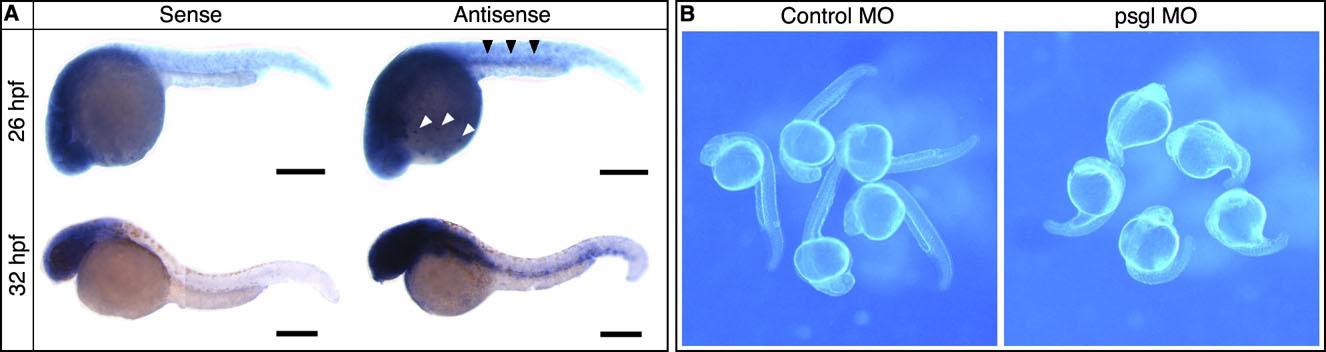
Fig. S3 Expression and Knockdown Analyses of psgl-1
This figure relates to Figure 4.
(A) WISH signal for psgl-1 mRNA, showing psgl-1 expressed in the trunk including the ICM region (black arrowheads) and macrophages (white arrowheads).
(B) Knockdown analysis of psgl-1. The morphants exhibited serious developmental arrest at 24 hpf. Scale bar represents 250 μm.
Acknowledgments
This image is the copyrighted work of the attributed author or publisher, and
ZFIN has permission only to display this image to its users.
Additional permissions should be obtained from the applicable author or publisher of the image.
Full text @ Curr. Biol.