
|
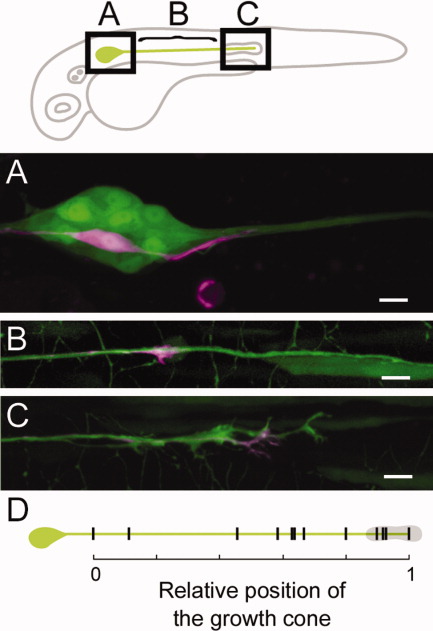
Fig. 2 Diversity of posterior lateral line (PLL) neurons in terms of the position of their growth cone. A-C: Three different mosaic embryos expressing DsRed (magenta) in a single PLL neuron in Tol047 embryos. A-C: The scheme on the top indicates the regions where the images were taken, i.e., near the PLL ganglion (A), on the PLL nerve (B), and at the leading edge of the PLL nerve, that is, in the primordium (C). All images were taken at 32 hpf. D: Distribution of individual growth cones. Black bars indicate the relative position of each growth cone. The relative position was quantified according to the following equation: relative position = somite number of labeled growth cone / somite number of tip of PLL nerve (n = 12). Gray area shows the primordium. Scale bars = 10 μm.