
Fig. 4
- ID
- ZDB-IMAGE-100706-29
- Genes
- Antibodies
- Publication
- Pujol-Martí et al., 2010 - Progressive neurogenesis defines lateralis somatotopy
- All Figures
- Figures for Pujol-Martí et al., 2010
|
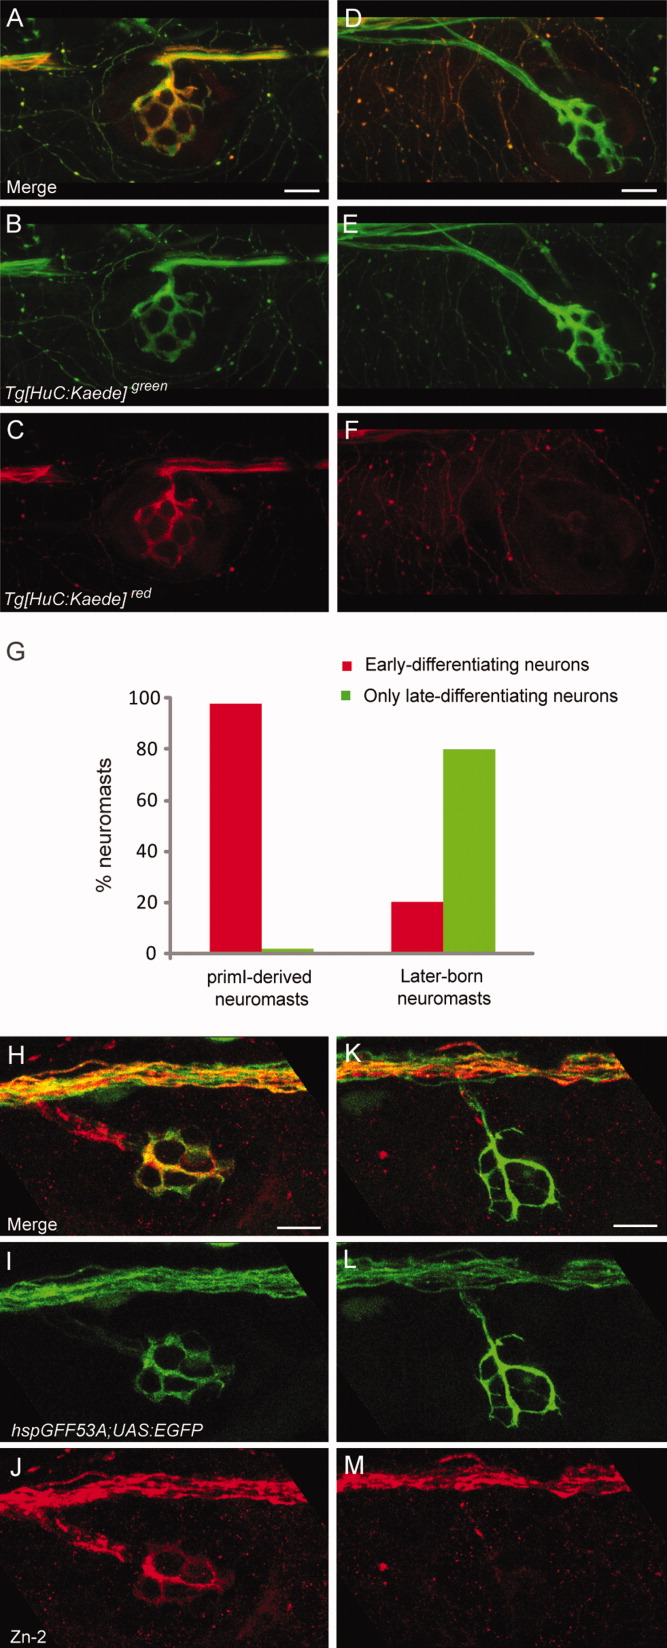
Fig. 4 Simultaneous analysis of lateralis afferent neuron differentiation time and peripheral target. A-F: Innervation of neuromast 3 from the first primordium (N3primI) (A-C) and neuromast 1 from the second primordium (N1primII) (D-F) from a photoconverted Tg[HuC:Kaede] transgenic fish. The photoconversion of Kaede was done at 25 hpf. A,D: Merge of Tg[HuC:Kaede]green (B,E) and Tg[HuC:Kaede]red (C,F) fluorescent signals. Early-differentiating neurons (photoconverted at 25 hpf) are yellow. Late-differentiating neurons appear only green. G: Percentage of primI-derived neuromasts (N=52) and later-born neuromasts (N=20) innervated by either Tg[HuC:Kaede]red neurons (early-differentiating, in red) or only Tg[HuC:Kaede]green neurons (late-differentiating, in green). H-M: Innervation of N1primI (H-J) and N1primII neuromasts (K-M) from a hspGFF53A;UAS:EGFP double-transgenic fish immunostained with Zn-2 MAb. H,K: Merge of EGFP (I,L) and Zn-2 (J,M) fluorescent signals. Neurons positive for hspGFF53A- and Zn-2 are green and red (yellow). Zn-2(-) neurons appear only green. All images were taken at 72 hpf, and are maximal projections and lateral views. Dorsal is towards top, anterior is towards left. Scale bars = 10 μm.