
Fig. 7
- ID
- ZDB-IMAGE-100706-25
- Publication
- Trapani et al., 2009 - Synaptojanin1 is required for temporal fidelity of synaptic transmission in hair cells
- All Figures
- Figures for Trapani et al., 2009
|
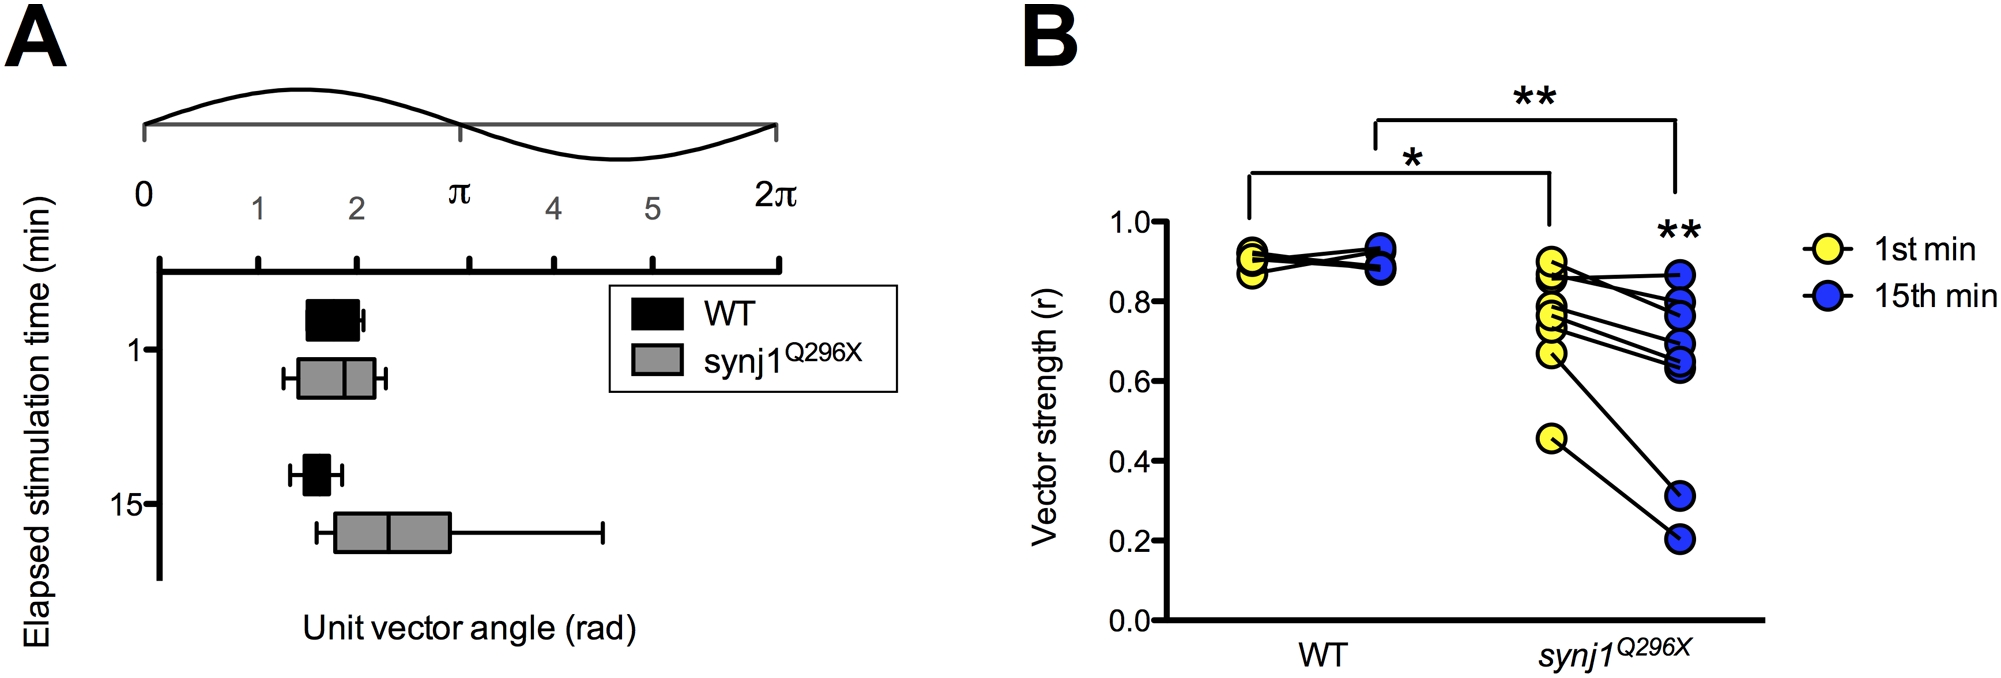
Fig. 7 The fidelity of phase locking is decreased in synj1Q296X larvae.
A) Box plot representing phase angles from the unit vectors described by all spikes in the 1st and 15th minute of 60 Hz stimulation from wild-type (black bars) and synj1Q296X (grey bars) larvae. Above the box plots is the corresponding 60 Hz stimulus cycle with phase scale in radians. B) Individual wild-type and synj1Q296X mutant vector strength (r) values for the 60 seconds of activity described in (A). Lines connect the 1st (yellow circles) and 15th (blue circles) minute of stimulation for each larval recording. Mutant vector strength was not only reduced at both time points compared to wild-type, but also from the 1st to the 15th minute of stimulation.