
Fig. 6
- ID
- ZDB-IMAGE-100706-24
- Publication
- Trapani et al., 2009 - Synaptojanin1 is required for temporal fidelity of synaptic transmission in hair cells
- All Figures
- Figures for Trapani et al., 2009
|
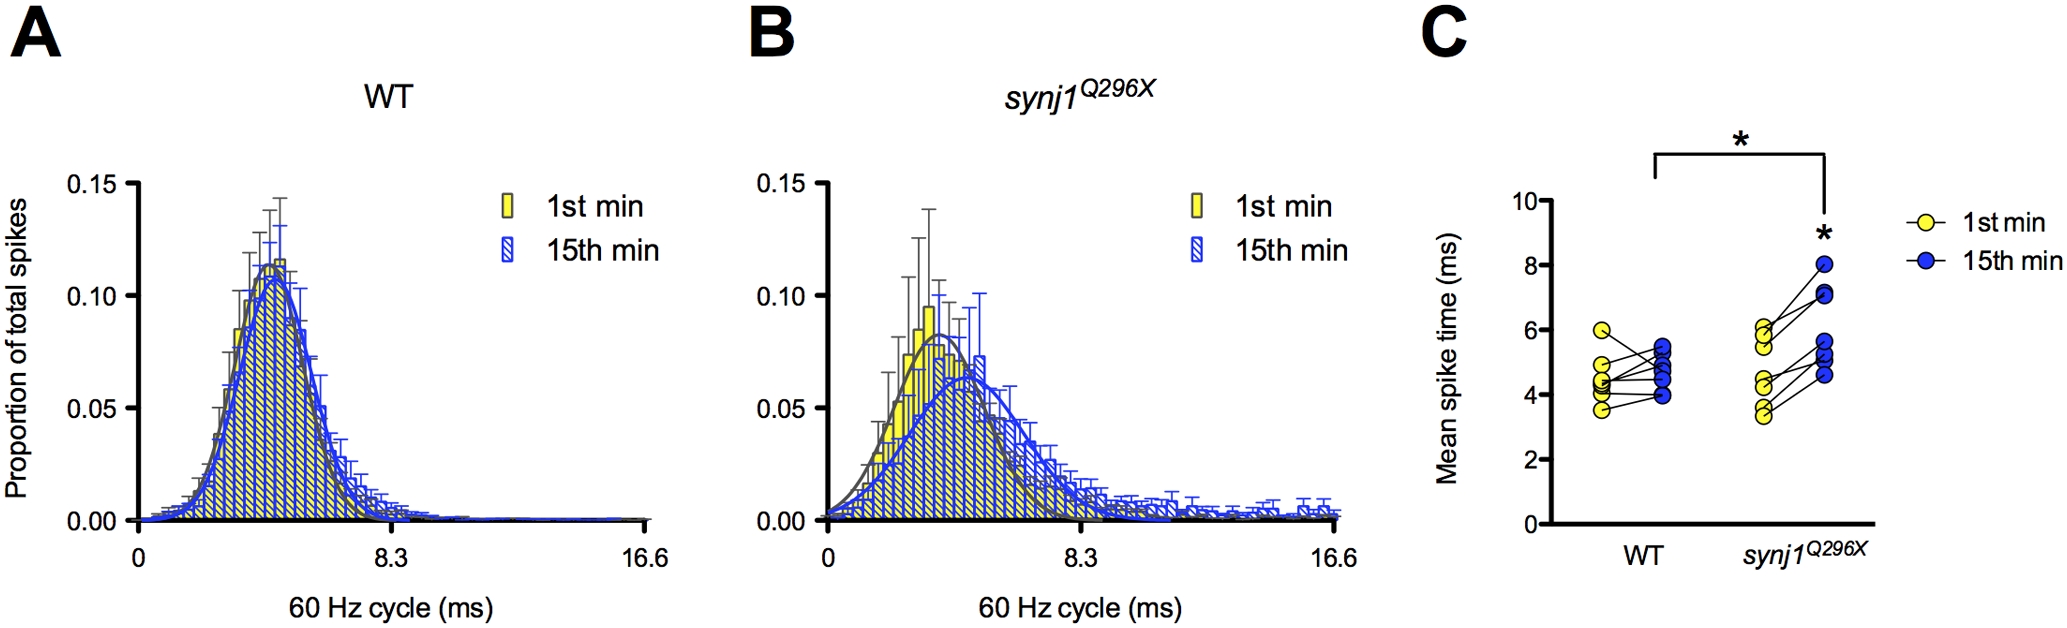
Fig. 6 The mean timing of spikes in response to 60 Hz stimulation is delayed in synj1Q296X mutants.
A, B) Histograms of 60 seconds of activity for (A) wild-type and (B) synj1Q296X afferent neurons in the first minute (yellow bars) and fifteenth minute (blue bars) of 60 Hz stimulation. The x-axis represents the length of one 60 Hz cycle in milliseconds. Curves were fit to Gaussian distributions (yellow and blue solid lines). C) Mean spike times of activity during 60 seconds of stimulation for individual wild-type and synj1Q296X mutants represented in (A). Lines connect the 1st (yellow circles) and 15th (blue circles) minute of stimulation for each larval recording. Following 15 minutes of sustained 60 Hz stimulation there was a significant delay in spike time compared to the first minute of stimulation in synj1Q296X as well as compared to wild-type after 15 minutes of stimulation.