
Image
|
Figure Caption
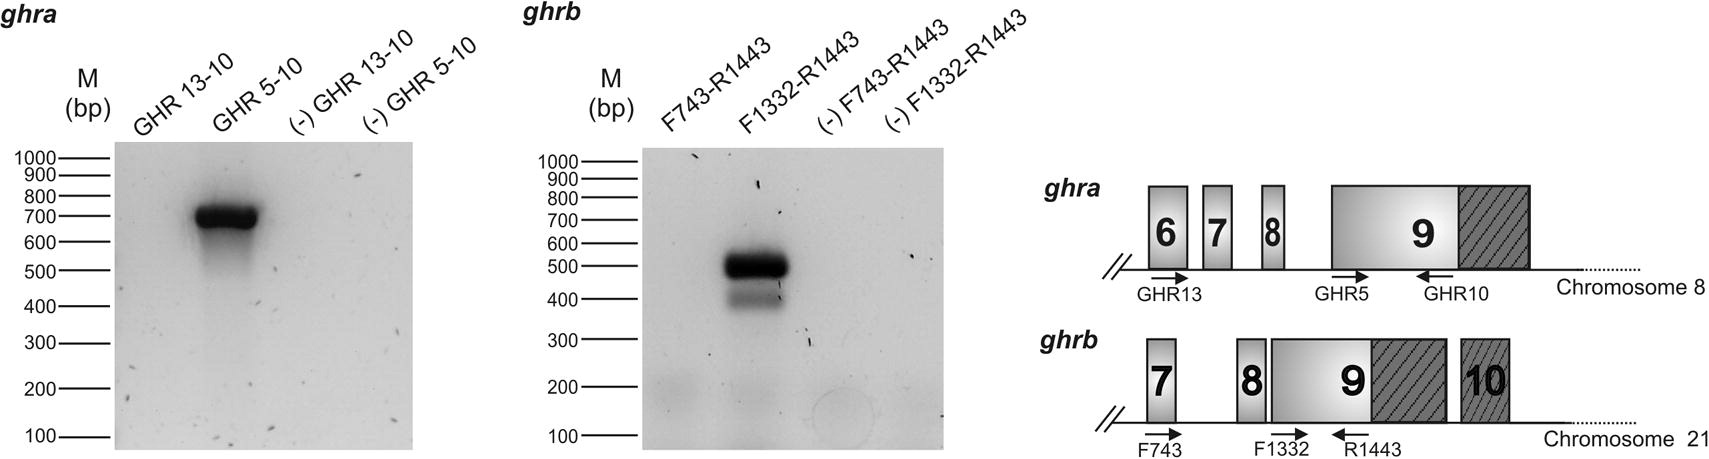
Fig. S2 Genomic PCRs of ghra and ghrb. Primer pairs used match in different exons (GHR13–10, F743–R1443) or in exon 9 (GHR5–10, F1332–R1443) as shown in the scheme (right). PCR with no template were carried out as negative controls (-), for each primer pair. Only the expected amplification product was obtained for ghra and two amplification products were obtained for ghrb. No product was obtained with primer pairs that match in different exons in both cases. The diagram on the right shows the approximate position of the primers used in the PCR.
Acknowledgments
This image is the copyrighted work of the attributed author or publisher, and
ZFIN has permission only to display this image to its users.
Additional permissions should be obtained from the applicable author or publisher of the image.
Reprinted from Gene expression patterns : GEP, 10(4-5), Di Prinzio, C.M., Botta, P.E., Barriga, E.H., Ríos, E.A., Reyes, A.E., and Arranz, S.E., Growth hormone receptors in zebrafish (Danio rerio): adult and embryonic expression patterns, 214-225, Copyright (2010) with permission from Elsevier. Full text @ Gene Expr. Patterns