
Fig. 6
- ID
- ZDB-IMAGE-100616-25
- Genes
- Publication
- Liu et al., 2010 - Expression of protocadherin-19 in the nervous system of the embryonic zebrafish
- All Figures
- Figures for Liu et al., 2010
|
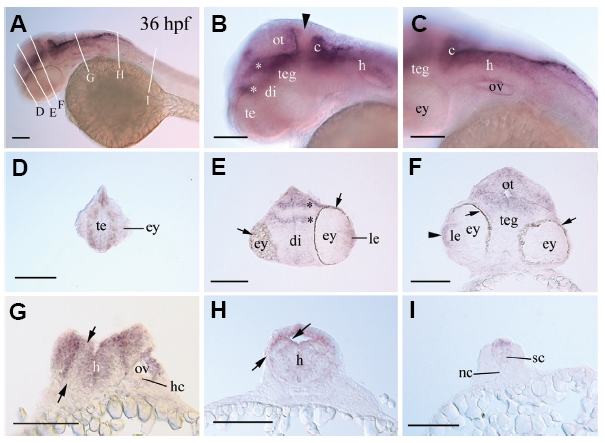
Fig. 6 Pcdh19 expression in 36 hpf embryos. (A,B,C) Lateral views of whole mount embryos showing the anterior 2/3 of the fish, the anterior head, and posterior head regions, respectively (anterior to the left and dorsal up). (D-I) Cross sections (dorsal up) from whole mount embryos processed for Pcdh19 in situ hybridization. Levels of the sections are shown in (A). The arrowhead in (B) points to the region with reduced Pcdh19 expression (also see Fig. 5F). Arrows in (E,F) indicate pigmented epithelium. The arrowhead in (F) points to Pcdh19 expression in the epithelial layer of the lens. Asterisks in (B,E) indicate the same thalamic regions with stronger Pcdh19 expression. The opposing arrows in (G,H) indicate the band of tissue with reduced Pcdh19 expression (also see Fig. 5N). Abbreviations are the same as in Fig. 5. Scale bars, 100 μm.