
IMAGE
Fig. S2
- ID
- ZDB-IMAGE-100616-23
- Antibodies
- Publication
- Mapp et al., 2010 - Prickle1b mediates interpretation of migratory cues during zebrafish facial branchiomotor neuron migration
- All Figures
- Figures for Mapp et al., 2010
Image
|
Figure Caption
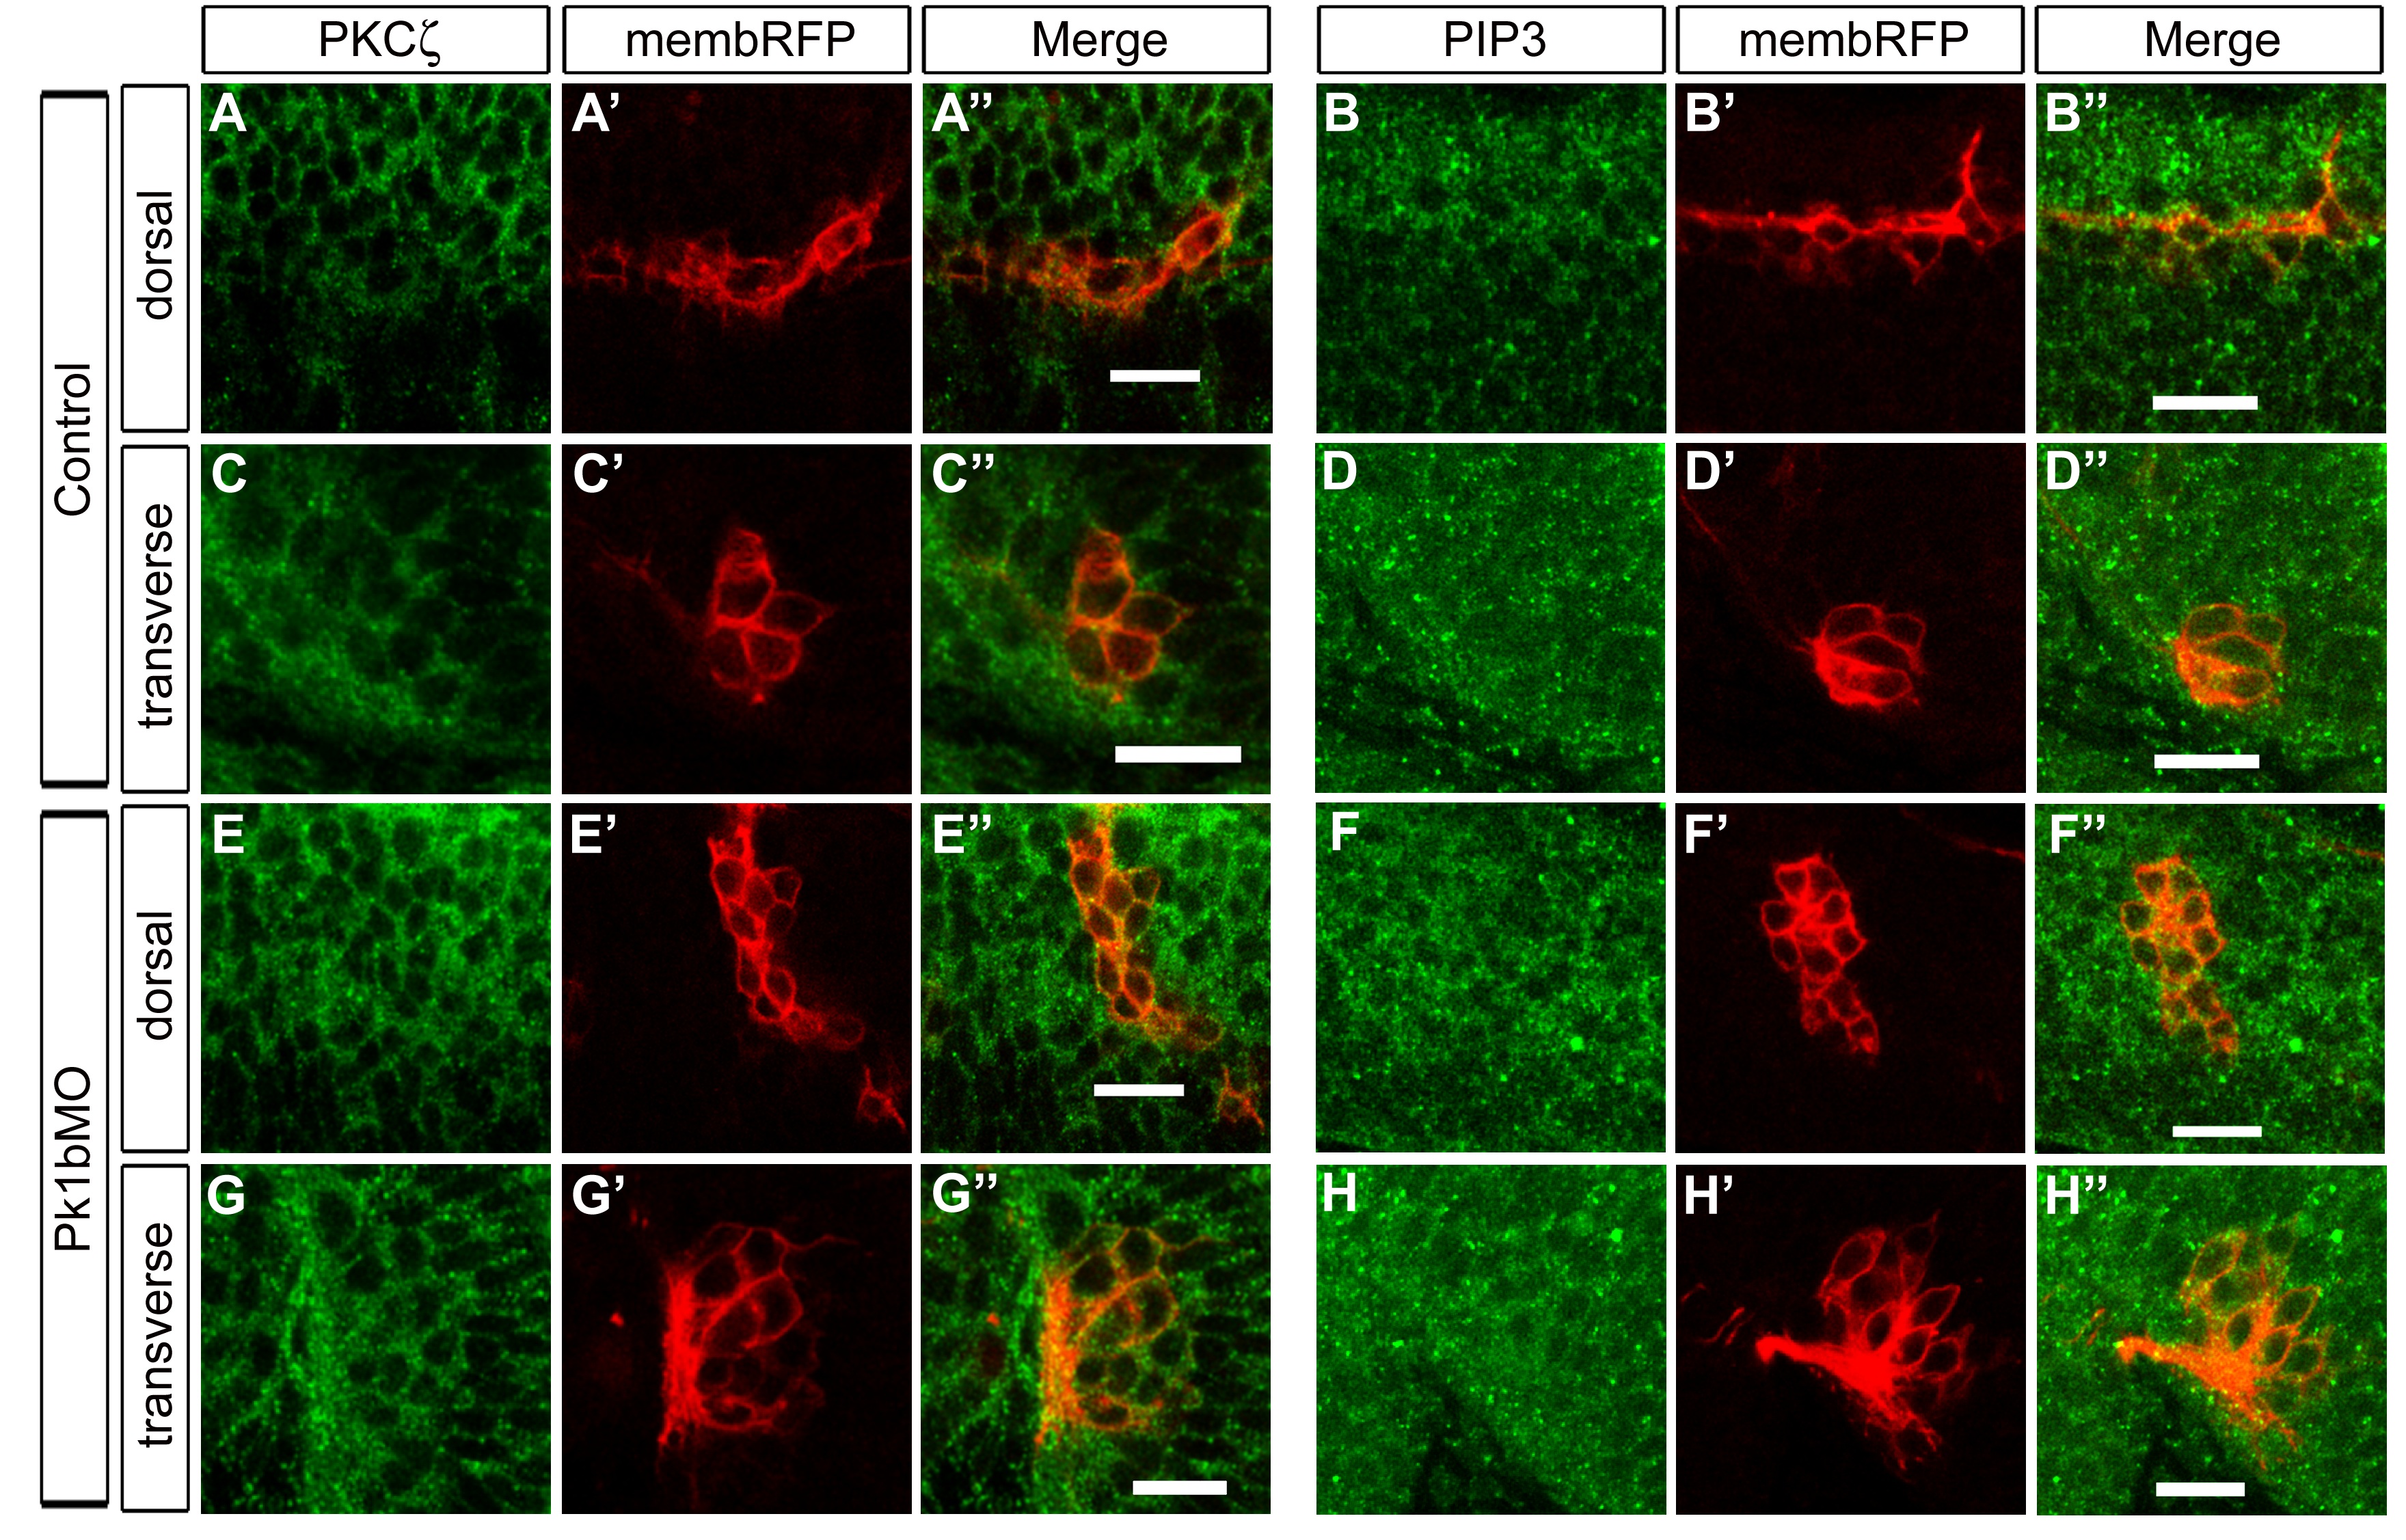
Fig. S2 PKCζ and PIP3 localization is comparable in control and Pk1b morphant embryos. A, B, E, F: Dorsal views of fixed zCREST1:membRFP transgenic embryos antibody stained for PKCζ (A, E) and PIP3 (B, F). C, D, G, H: Transverse views of fixed zCREST1:membRFP transgenic embryos antibody stained for PKCζ (C, G) and PIP3 (D, H). Embryos were sectioned through r5 (C, D) or r4 (G, H). Scale bar = 20 μm.
Figure Data
Acknowledgments
This image is the copyrighted work of the attributed author or publisher, and
ZFIN has permission only to display this image to its users.
Additional permissions should be obtained from the applicable author or publisher of the image.
Full text @ Dev. Dyn.