
|
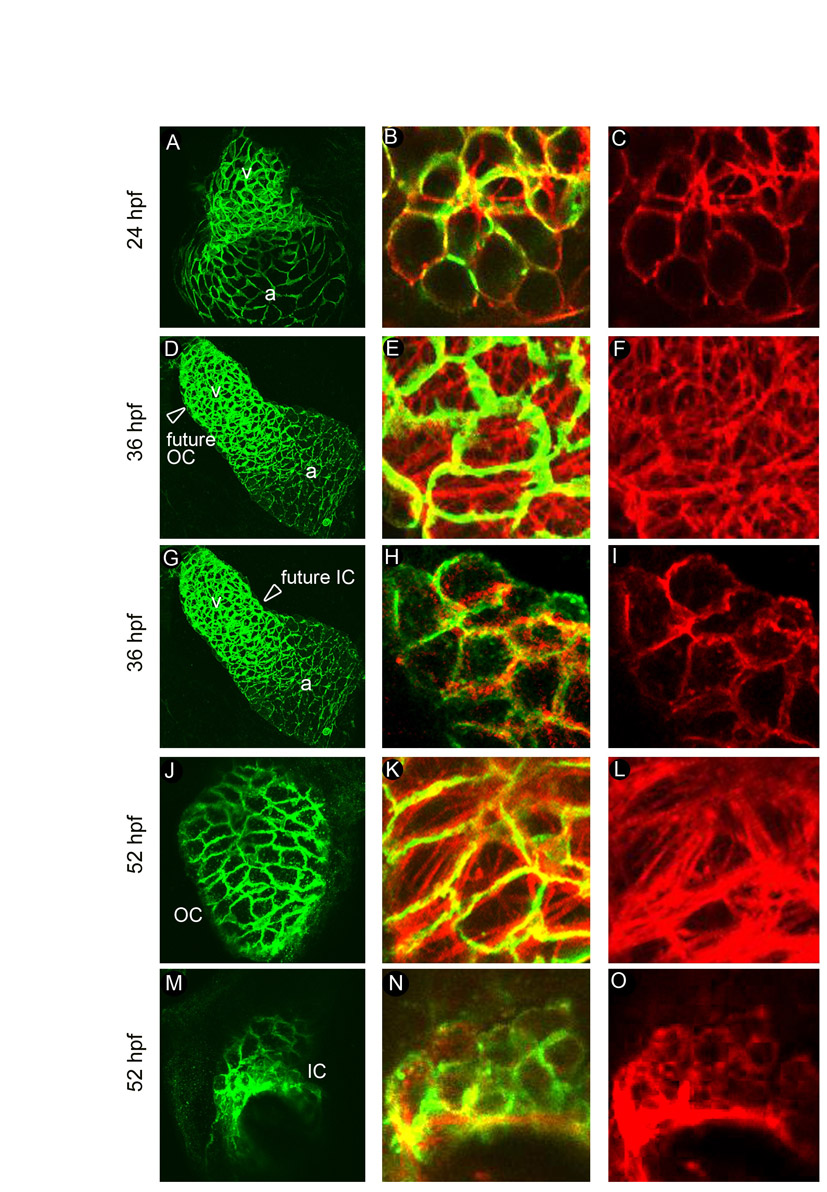
Fig. S2 The distribution of F-actin in myocardial cells correlates with cellular shape and location during chamber emergence. (A-O) WT hearts at 24 (A-C), 36 (D-I) and 52 (J-O) hpf were co-stained with anti-DM-GRASP antibodies (green) to outline cell shape and with phalloidin (red) to visualize F-actin. Low-magnification (A,D,G,J,M) and head-on high-magnification confocal merged (B,E,H,K,N) and red only (actin only; C,F,I,L,O) images are shown. (A-C) At 24 hpf, when linear heart tube cells are circular, F-actin is largely localized to the CM cell peripheries. (D-I) At 36 hpf, presumptive future ventricular OC and IC cells, based on their location in the heart tube (arrowheads in D and G), display differential patterns of F-actin distribution. Whereas future OC cells exhibit prominent non-cortical F-actin cables (E,F), future IC cells retain F-actin at the cell peripheries (H,I). (J-O) By 52 hpf, definitive OC and IC cells show similar F-actin arrangements as their predecessors at 36 hpf.