
Fig. S2
- ID
- ZDB-IMAGE-100525-37
- Publication
- Okuda et al., 2010 - B1 SOX coordinate cell specification with patterning and morphogenesis in the early zebrafish embryo
- All Figures
- Figures for Okuda et al., 2010
|
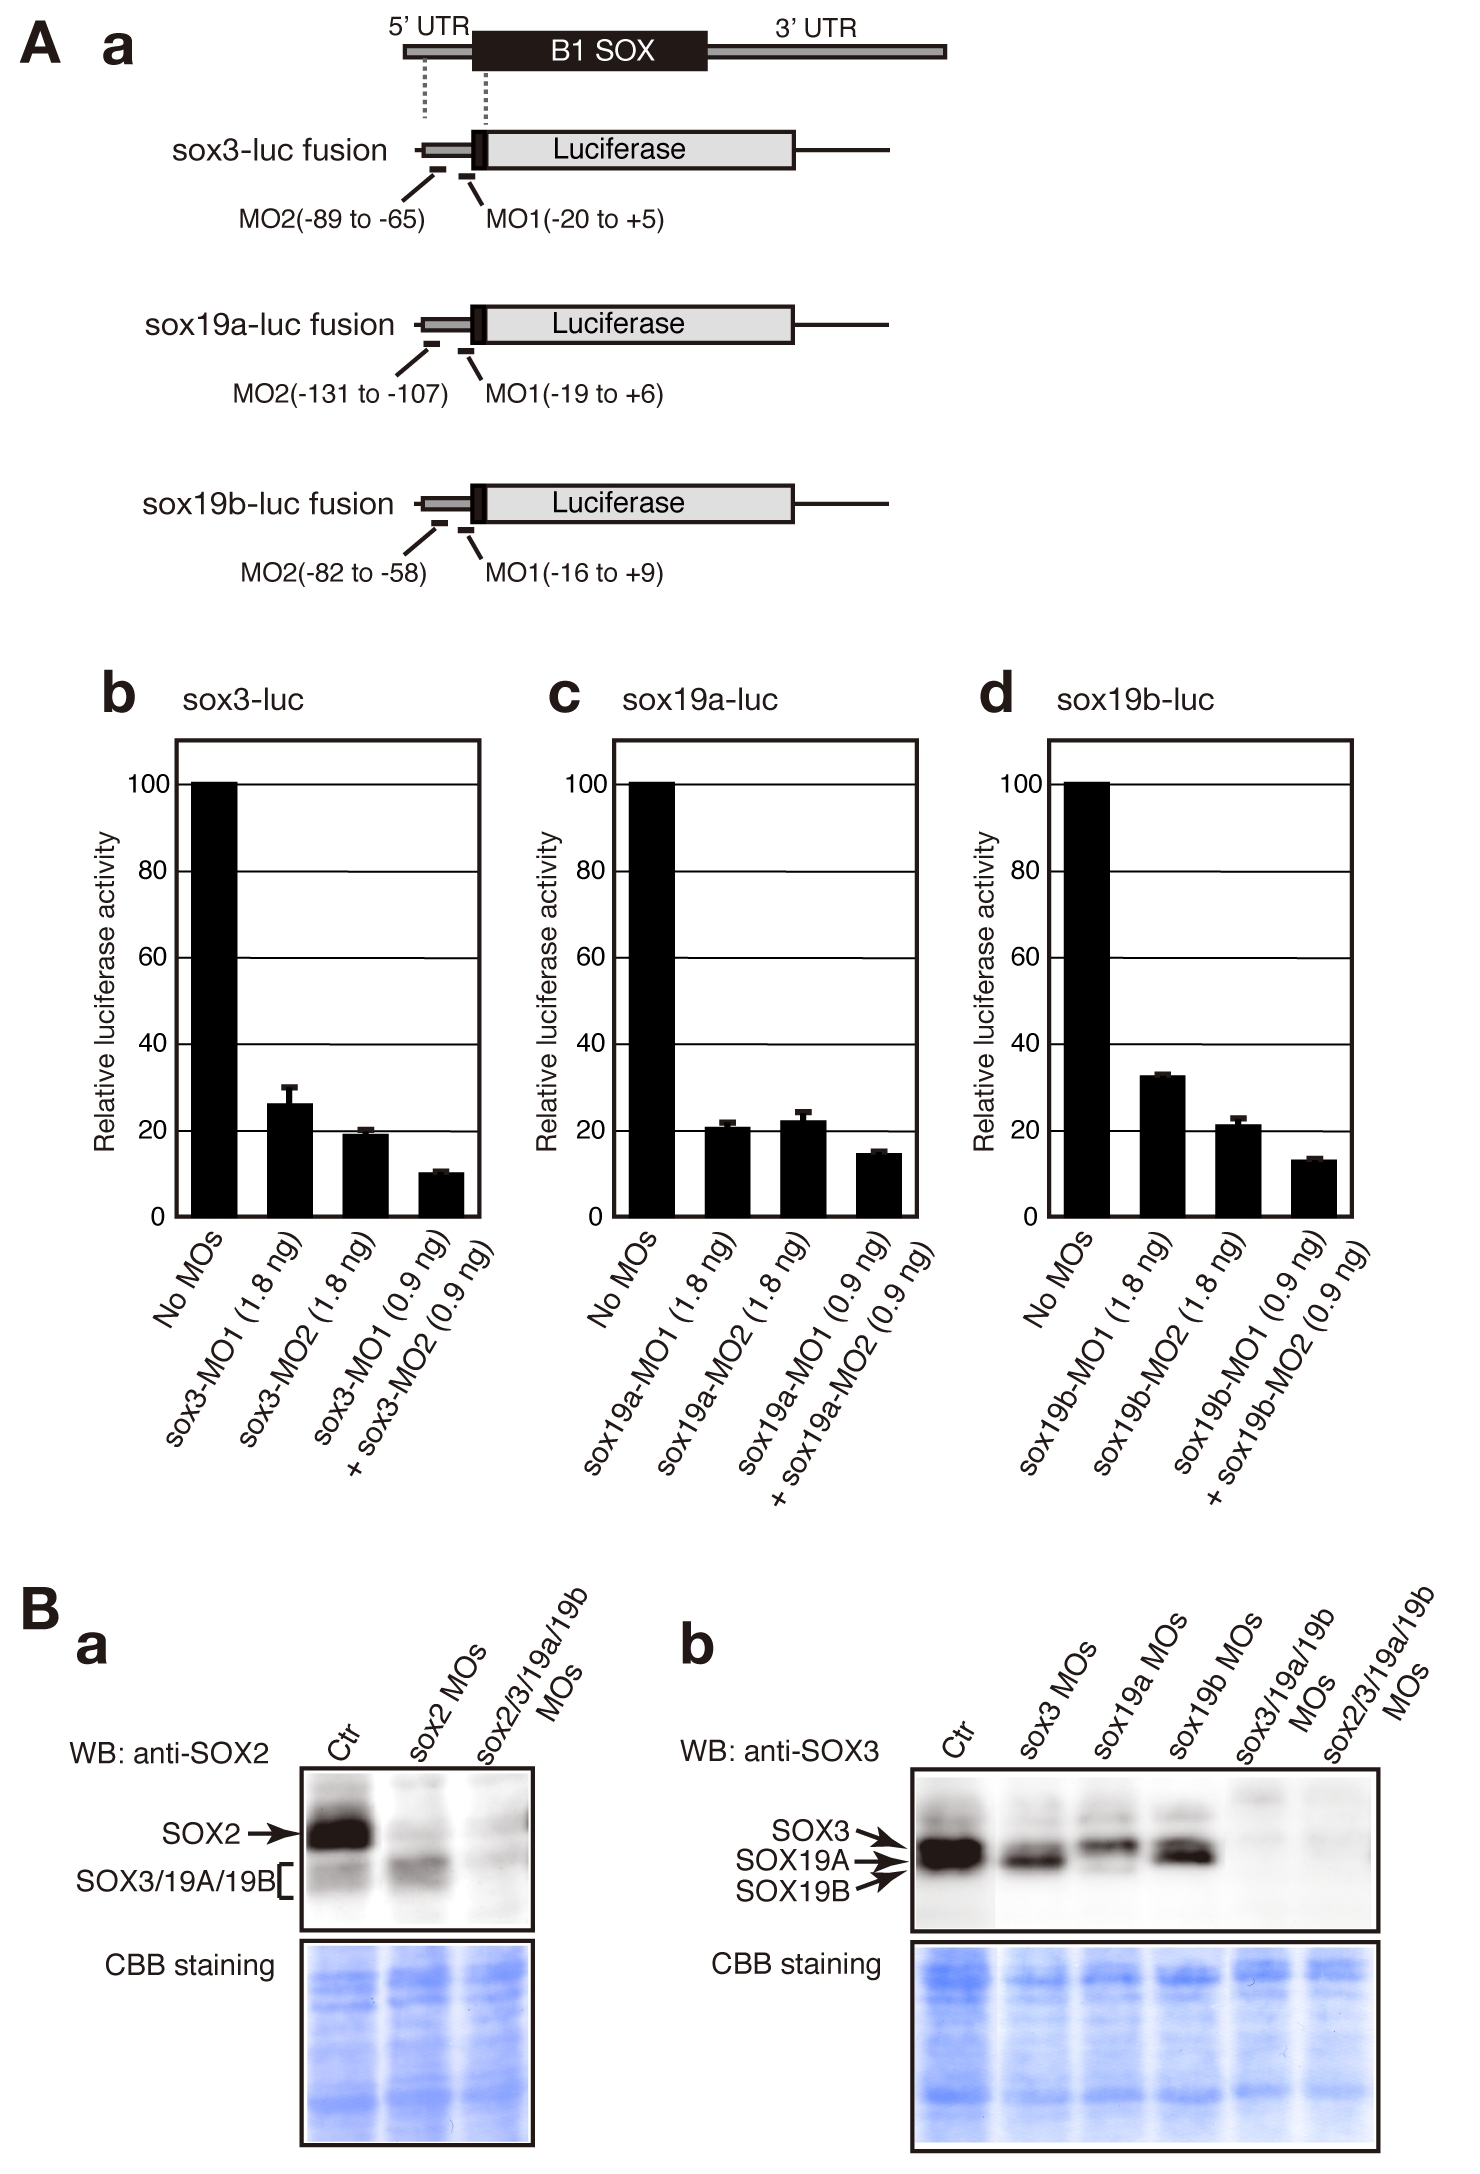
Fig. S2 Evaluation of the knockdown efficiency of MOs targeting sox2, sox3, sox19a and sox19b. (A) Quantitative evaluation of the knockdown efficiency of MOs targeting sox3, sox19a and sox19b using a luciferase assay. (a) Schematic representation of sox3-luc, sox19a-luc and sox19b-luc fusion RNA constructs. (b–d) Inhibition levels caused by the injection of sox3-MOs (b), sox19a-MOs (c) and sox19b-MOs (d) were quantitatively measured using the luciferase assay-based system. Luciferase activity was measured using more than 20 injected embryos of the tailbud to early somite stages per sample. The luciferase activity generated by each sox-luc fusion in the absence of MOs was arbitrarily assigned a value of 100. Data are shown as the average values of three independent injection experiments with standard errors. (B) Inhibition of endogenous B1 SOX expression analyzed by western blotting. Lysates for SDS-PAGE were prepared using tailbud to early somite stage embryos that had been injected with the indicated MOs. The knockdown conditions were the same as those described in Figure 1. A seven-embryo equivalent amount of the lysate was used per lane. Western blotting was performed using an anti-SOX2 antibody that weekly cross-reacts with SOX3/19A/19B (a) and an anti-SOX3 antibody that preferentially detects SOX3/19A/19B (b). Note that the SOX19B expression levels are low at these stages.