
|
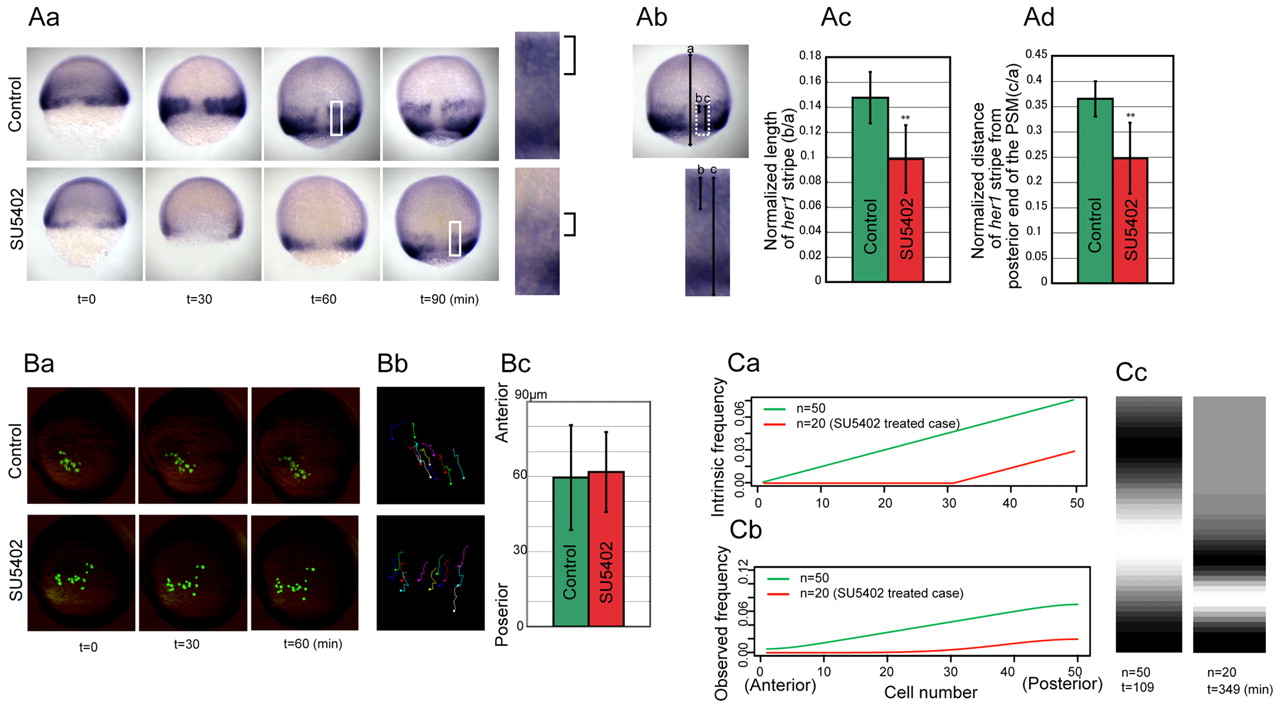
Fig. 3 Effect of Fgf inhibition on the her1 oscillation period. (Aa-d) Effect of compromised Fgf signaling on the spatial oscillation pattern of her1. (a) Time series of her1 expression in control (upper) and SU5402-treated (lower) zebrafish embryos. We set the 50% epiboly stage as t=0. The boxed regions, in those images taken at the time points that the her1 stripe first appears, are enlarged to the right. Brackets indicate the first her1 stripes. (b) The length of the her1 stripe (line b) and the distance between the her1 stripe and the posterior end of the PSM (line c) were measured and normalized by embryonic size (line a). (c,d) The normalized length of the her1 stripe and the normalized distance of the her1 stripe from the posterior end of the PSM in SU5402-treated embryos were significantly shorter than in the control; **, P<0.01 (n=12 for control embryos and n=11 for SU5402 treatment). Error bars indicate s.d. (Ba-c) The effect of SU5402 treatment on gastrulation cell movement was limited. (a) Time-course images of the labeled cells with or without SU5402 treatment. The cellular movement was then tracked every 10 minutes (b) and quantified (c). The mean net displacement towards the posterior direction (n=25 cells from three embryos for control and n=34 cells from three embryos for SU5402 treatment) reveals no significant difference in gastrulation movement following the treatment (c). Error bars indicate s.d. (Ca-c) Simulation of a decreased frequency gradient. (a,b) The intrinsic (a) and observed (b) frequency. n indicates the number of cells that were given the gradient of intrinsic frequency. The intrinsic frequency for the SU5402-treated case was fixed at 0 in the cells i=1-30 (a, red) (see Fig. S3 in the supplementary material). (c) The simulated stripe pattern of her1 expression when the stripe first appeared in each condition. n and t beneath the panels indicate the number of cells that were given the gradient of intrinsic frequency and the elapsed time, respectively. Coupling between non-oscillatory cells (n=0-30 in the SU5402-treated case) and oscillatory cells was maintained in this simulation, but we confirmed that the same trend was obtained in the absence of coupling.