
|
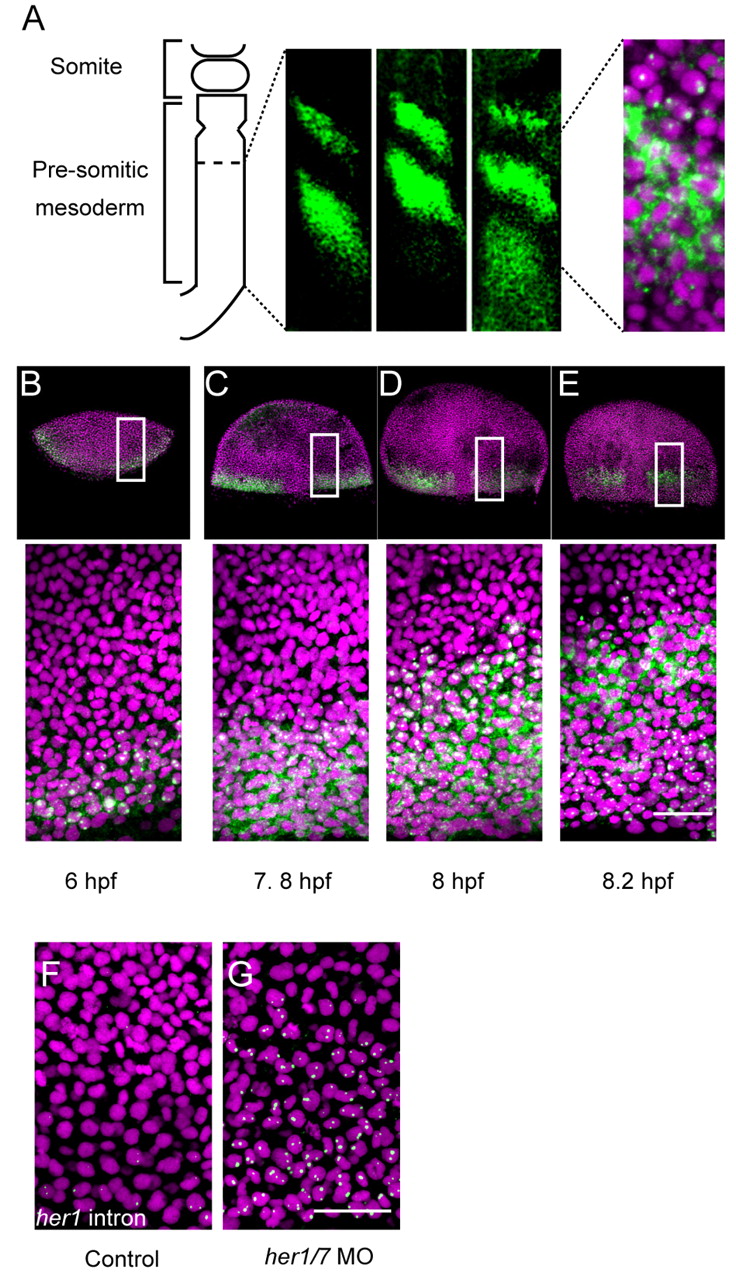
Fig. 1 Overview of the segmentation clock in the zebrafish embryo. Anterior to top, posterior to bottom. Green, her1 mRNA in situ hybridization; magenta, nuclear counterstain. (A) Subcellular localization of her1 mRNA in the traveling wave during the segmentation stage. (B-E) Emergence of the traveling wave at the blastula stage. The boxed regions are enlarged in the panels beneath. (F,G) Control and her1/7 morpholino-injected samples. The injected morpholino was designed against the first ATG and her1 transcripts were detected with the intron probe; thus, the signals detected cannot result from mRNA stabilized by morpholino binding. Scale bar: 50 μm.