
|
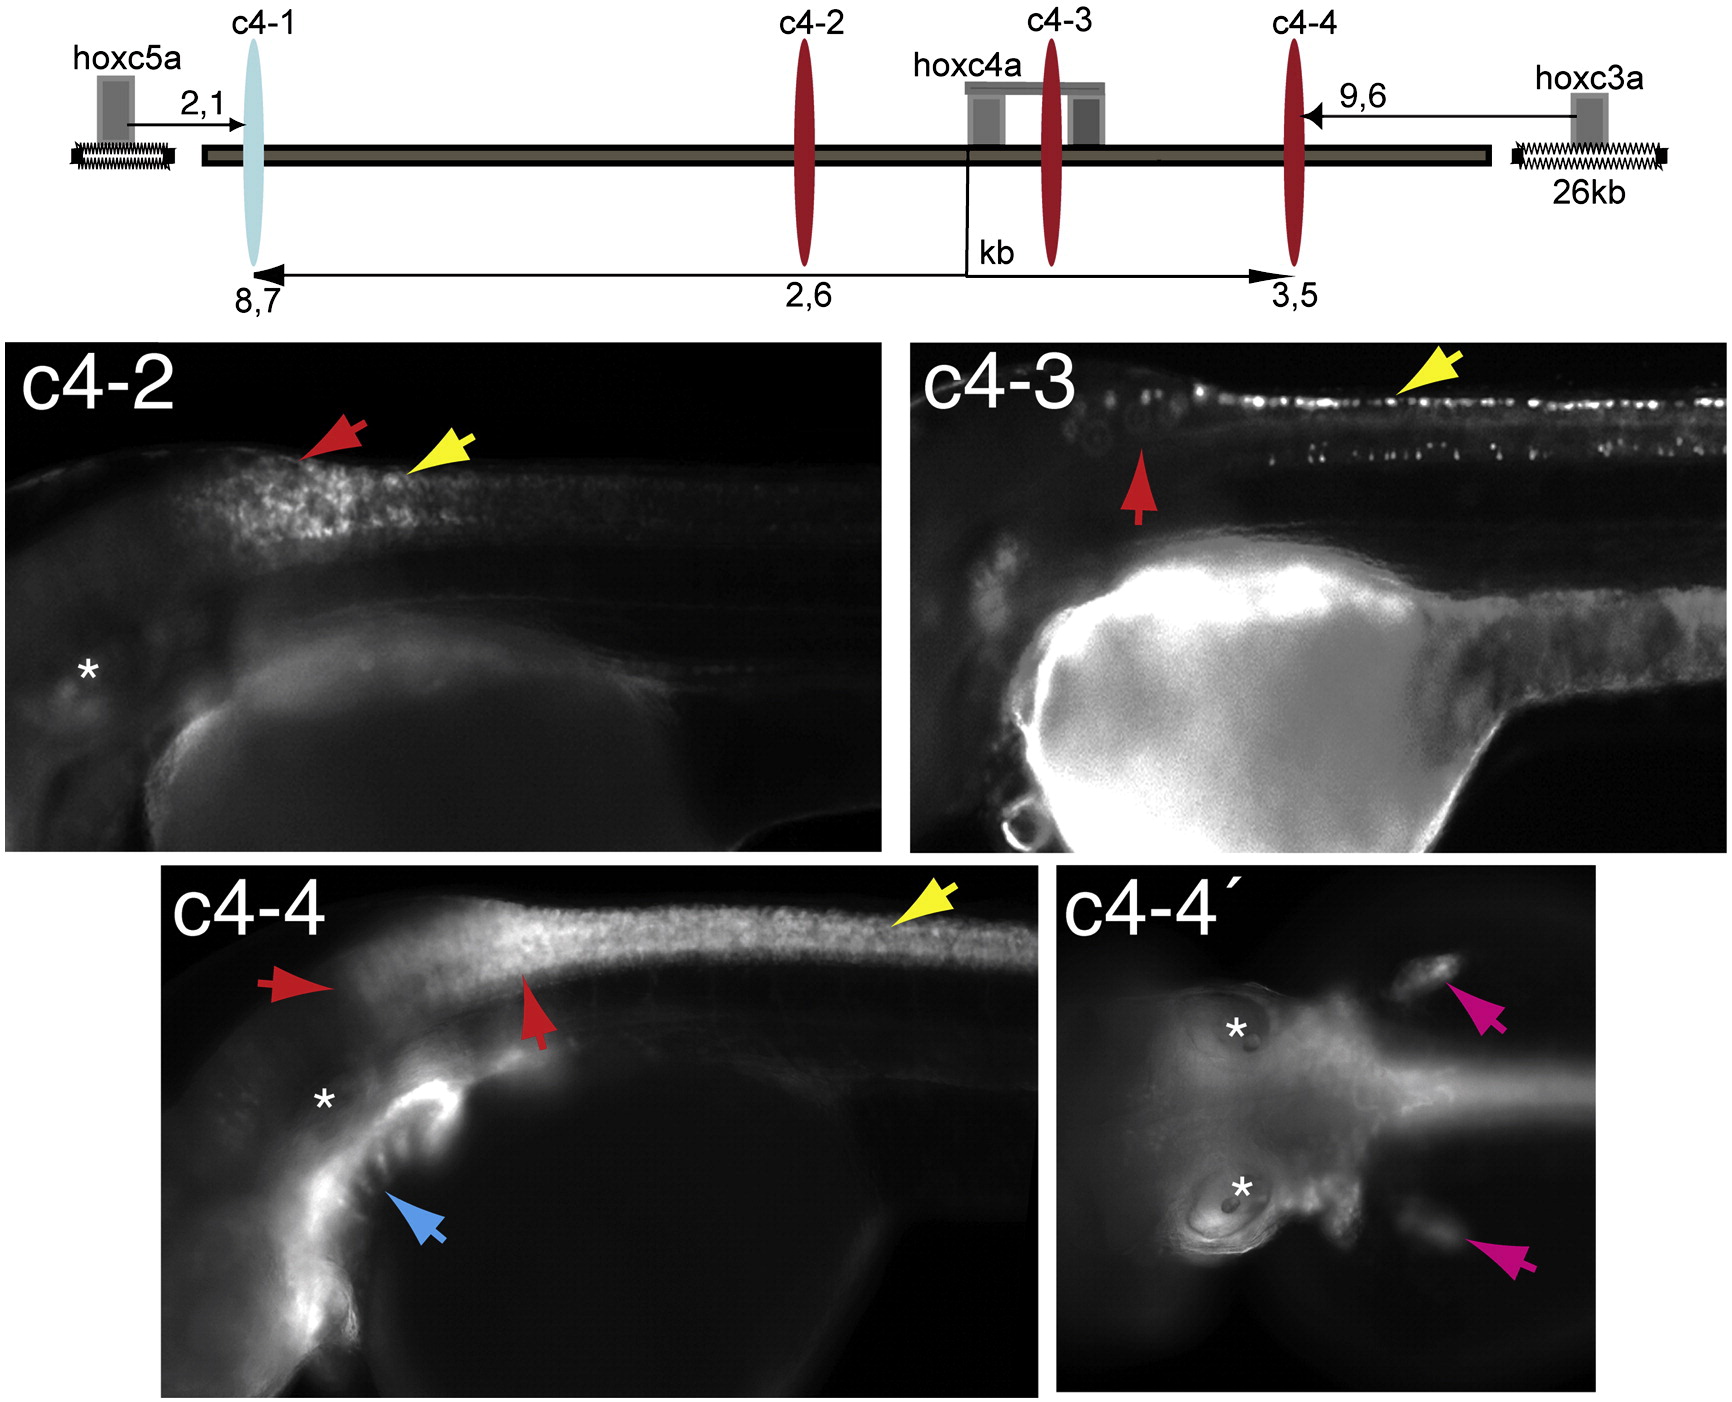
Fig. 6 Schematic of the hoxc5a to hoxc3a genomic region. Tested CNEs are illustrated as explained in [Fig. 4] and [Fig. 5]. Representative GFP expressing larvae are shown at stages 2 to 4 dpf. The asterisk marks the level of the inner ear. The arrows follow a color code: red, hindbrain; yellow, spinal cord; dark blue, pharyngeal arches; pink, pectoral fins. c4-2. Larva with GFP expression in the hindbrain r7 and r8 extending weaker into the anterior spinal cord. c4-2′. Dorsal view of the same larva as in A with posterior hindbrain and pectoral fin expression. c4-3. Larva with GFP expression in the posterior hindbrain and in the spinal cord. c4-3′. Another line with higher magnification shows single GFP labeled cells in hindbrain r7 and further expression in the pharyngeal arches. c4-4. Larva with expression in the hindbrain r7 and r8, in the spinal cord and also in all pharyngeal arches. c4-4′. A dorsal view of a larva with focus on GFP expression in the pectoral fins.
Reprinted from Developmental Biology, 340(2), Punnamoottil, B., Herrmann, C., Pascual Anaya, J., D'Aniello, S., Garcia-Fernàndez, J., Akalin, A., Becker, T.S., and Rinkwitz, S., Cis-regulatory characterization of sequence conservation surrounding the Hox4 genes, 269-282, Copyright (2010) with permission from Elsevier. Full text @ Dev. Biol.