
Fig. 4
- ID
- ZDB-IMAGE-100322-15
- Publication
- Kimmel et al., 2010 - Modes of developmental outgrowth and shaping of a craniofacial bone in zebrafish
- All Figures
- Figures for Kimmel et al., 2010
|
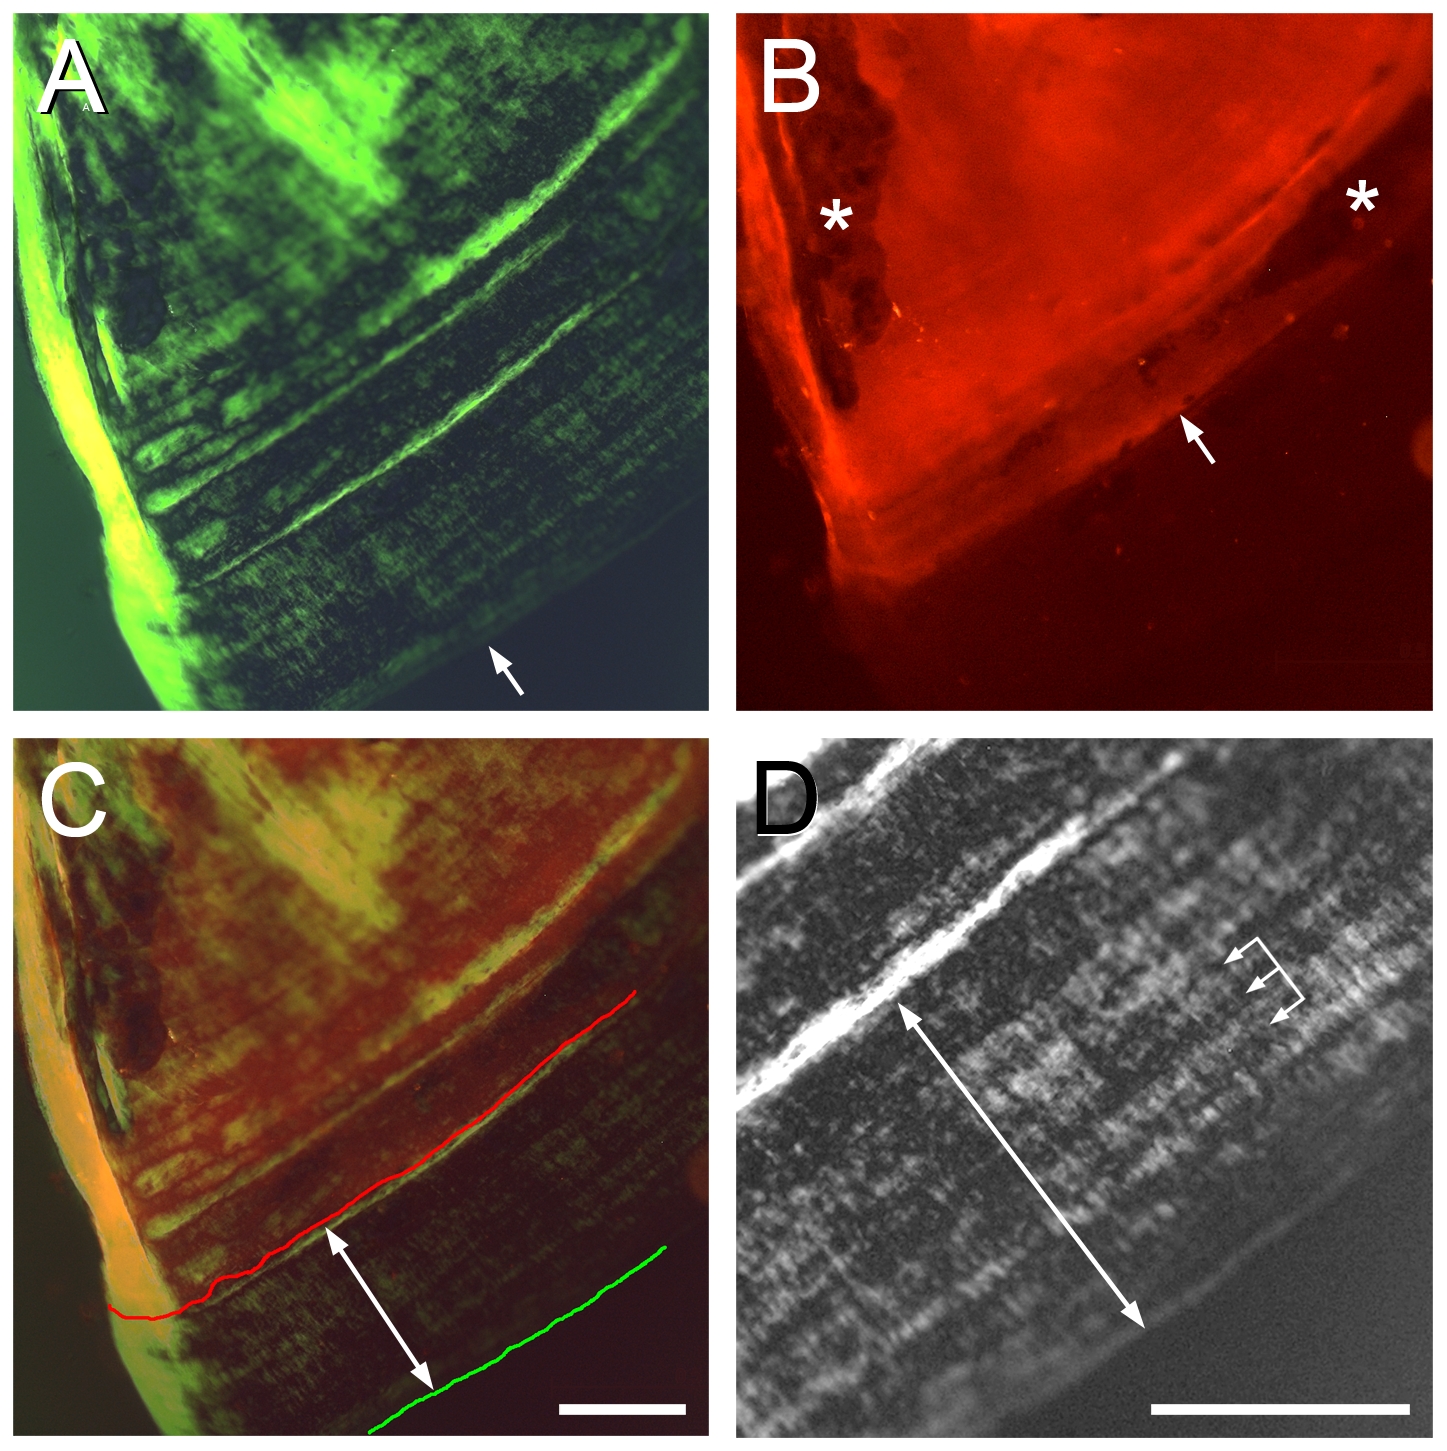
Fig. 4 The Op of the young adult shows a high rate of incremental banding outgrowth of the vp edge.
(A) Image at 54 dpf with green monochromatic (to increase resolution) transmitted light, and crossed-polarizing filters to reveal birefringence and the incremental banding pattern. The arrow indicates the vp edge of the bone. (B) Epiflorescence of Alizarin Red S, applied as a pulse at 43 dpf, in the same field as in A. The labeling front (arrow) shows where the vp edge was located at the 43 dpf stage. Sites (Howship′s lacunae) of likely remodeling (bone resorption by osteoclasts, followed by replacement with new, unlabeled bone) in the old bone behind this front are indicated by asterisks. (C) Merge of A and B. The Alizarin Red front is indicated by the red line, the bone vp edge by the green line, and the double-headed arrow shows the approximate extent of outgrowth during the 11 day interval after labeling (an average 333 µm, from several measurements along the bone). (D) Detail of the banding pattern between the labeling front and the bone edge (double-headed arrow). Widths of prominent bands are about 30 μm; the three linked arrows show two 30 μm intervals. We note more finely spaced bands are also present, and that we measured a substantial variation in bandwidths among different preparations. Scale bars: 200 μm.