
Fig. S5
- ID
- ZDB-IMAGE-100302-58
- Publication
- Seo et al., 2010 - BBS6, BBS10, and BBS12 form a complex with CCT/TRiC family chaperonins and mediate BBSome assembly
- All Figures
- Figures for Seo et al., 2010
|
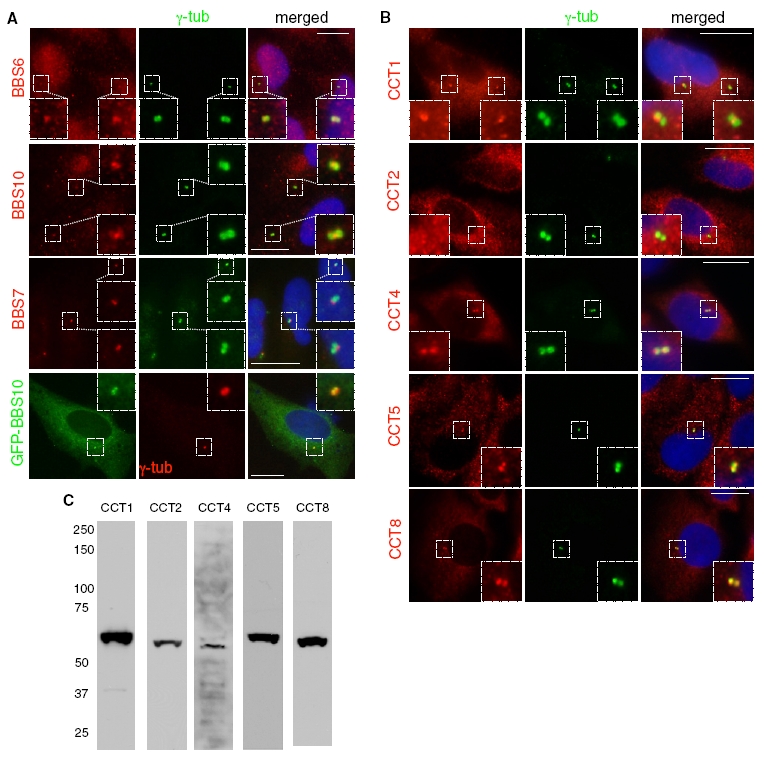
Fig. S5 Localization of chaperonin-like BBS proteins and CCT chaperonins to centrosomes. (A) Indirect immunofluorescence results for BBS6, BBS10, BBS7, and GFP-BBS10. (Left) Localization of BBS proteins. (Center) Location of centrosomes (γ-tubulin). (Right) Merged images with DAPI staining for the nucleus (blue). Inlets are enlarged images of the boxed areas around centrosomes. (Scale bars, 10 μm.) (B) Indirect immunofluorescence results for CCT1, CCT2, CCT4, CCT5, and CCT8. Others are the same as in A. (C) Characterization of CCT antibodies. Immunoblotting results with antibodies against CCT1, CCT2, CCT4, CCT5, and CCT8. Each antibody recognizes a single, endogenous protein with predicted molecular weights (60.3 kDa, 57.5 kDa, 57.9 kDa, 59.7 kDa, and 59.6 kDa, respectively).