
|
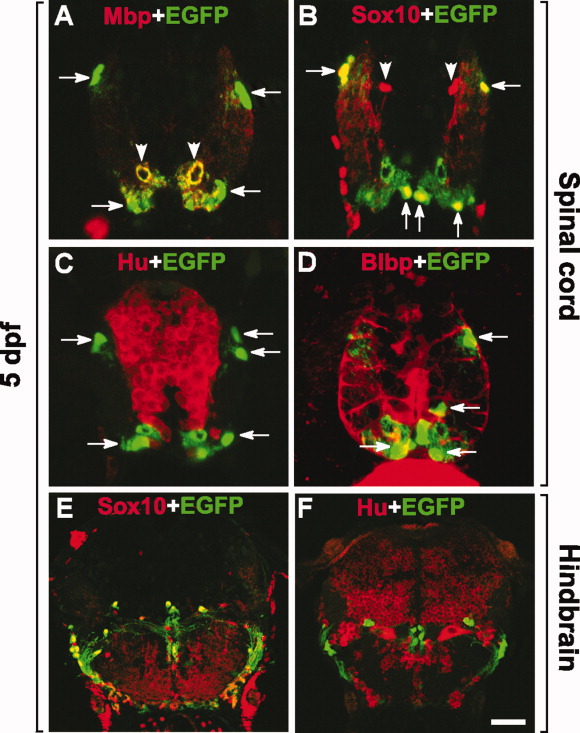
Fig. 2 mbp+ cells are exclusively expressed in oligodendrocytes. A-F: All images are transverse sections of the spinal cord (A-D) and hindbrain (E,F) of 5 dpf Tg(mbp:egfp) zebrafish, dorsal up. A: Labeling with an anti-MBP antibody to mark oligodendrocyte myelin processes. Arrows indicate enhanced green fluorescent protein-positive (EGFP+) cell bodies and arrowheads indicate MBP+, EGFP+ myelin processes. B: Labeling with an anti-Sox10 antibody to mark OPCs and oligodendrocytes. Arrows indicate Sox10+, EGFP+ oligodendrocytes in the white matter and arrowheads indicate Sox10+, EGFP- OPCs in the gray matter. C,D: Labeling with anti-Hu and anti-Blbp antibodies to mark neurons and radial glia, respectively. Arrows indicate EGFP+ oligodendrocytes. E,F: Labeling of hindbrain sections with anti-Sox10 and anti-Hu antibodies to detect oligodendrocytes and neurons, respectively. All EGFP+ cells are Sox10+ and Hu- oligodendrocytes. Scale bar = 20 μm in A-D; 40 μm in E,F.