
IMAGE
Fig. 2
Image
|
Figure Caption
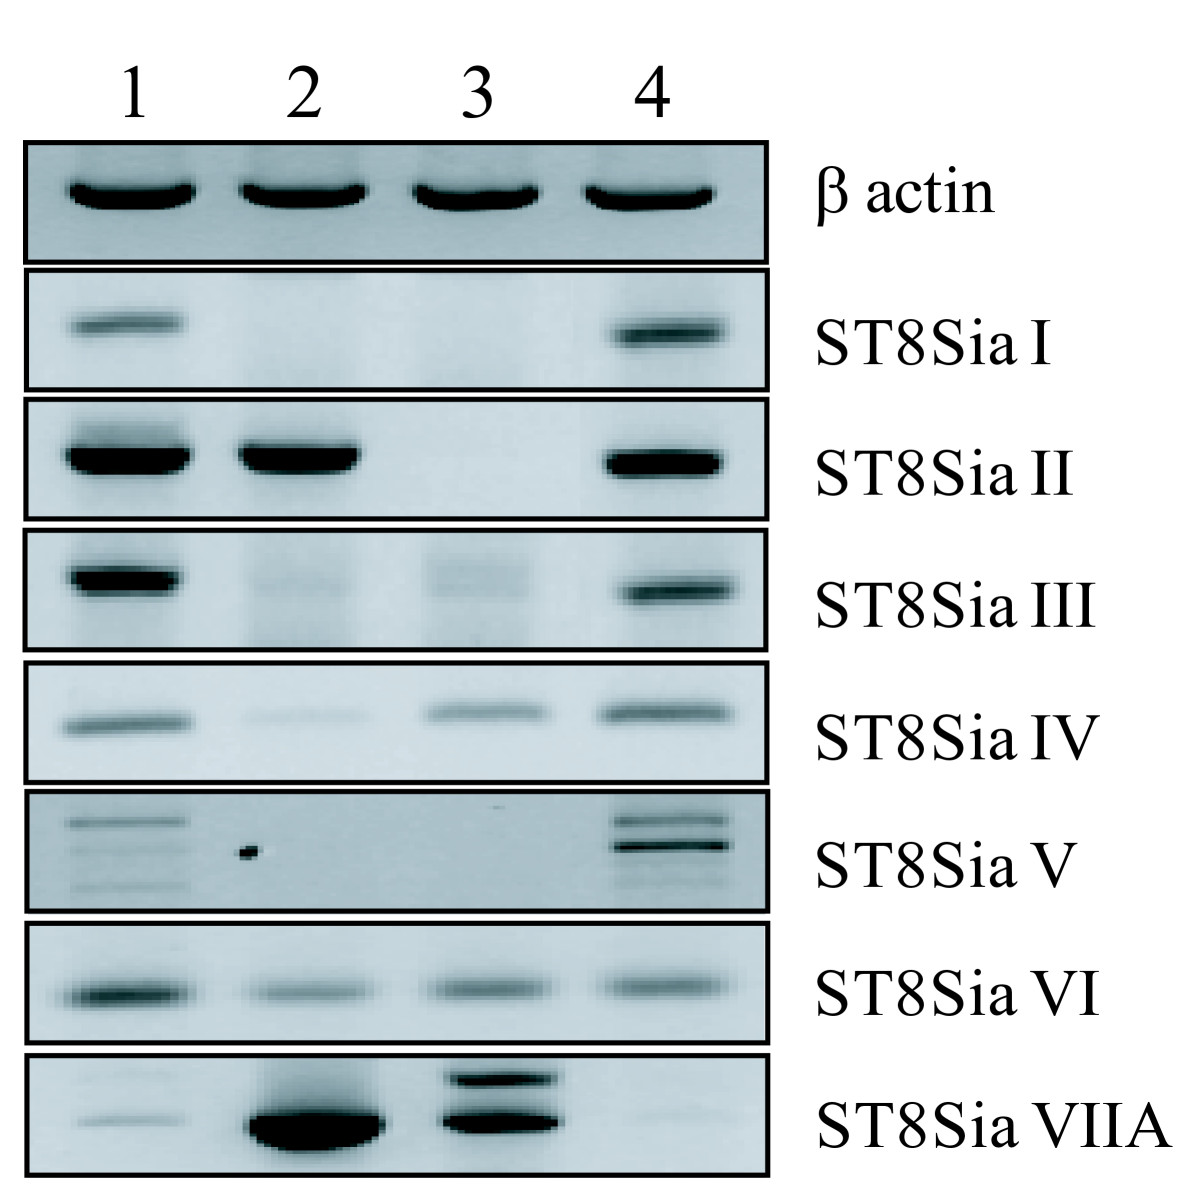
Fig. 2 Expression pattern of the zebrafish ST8Sia genes in various tissues, as determined by RT-PCR. Lane 1, 36 h embryo; lane 2, ovary; lane 3, intestine; lane 4, brain. The zebrafish β-actin gene was used as a positive control of PCR amplification.
Figure Data
Acknowledgments
This image is the copyrighted work of the attributed author or publisher, and
ZFIN has permission only to display this image to its users.
Additional permissions should be obtained from the applicable author or publisher of the image.
Full text @ BMC Evol. Biol.