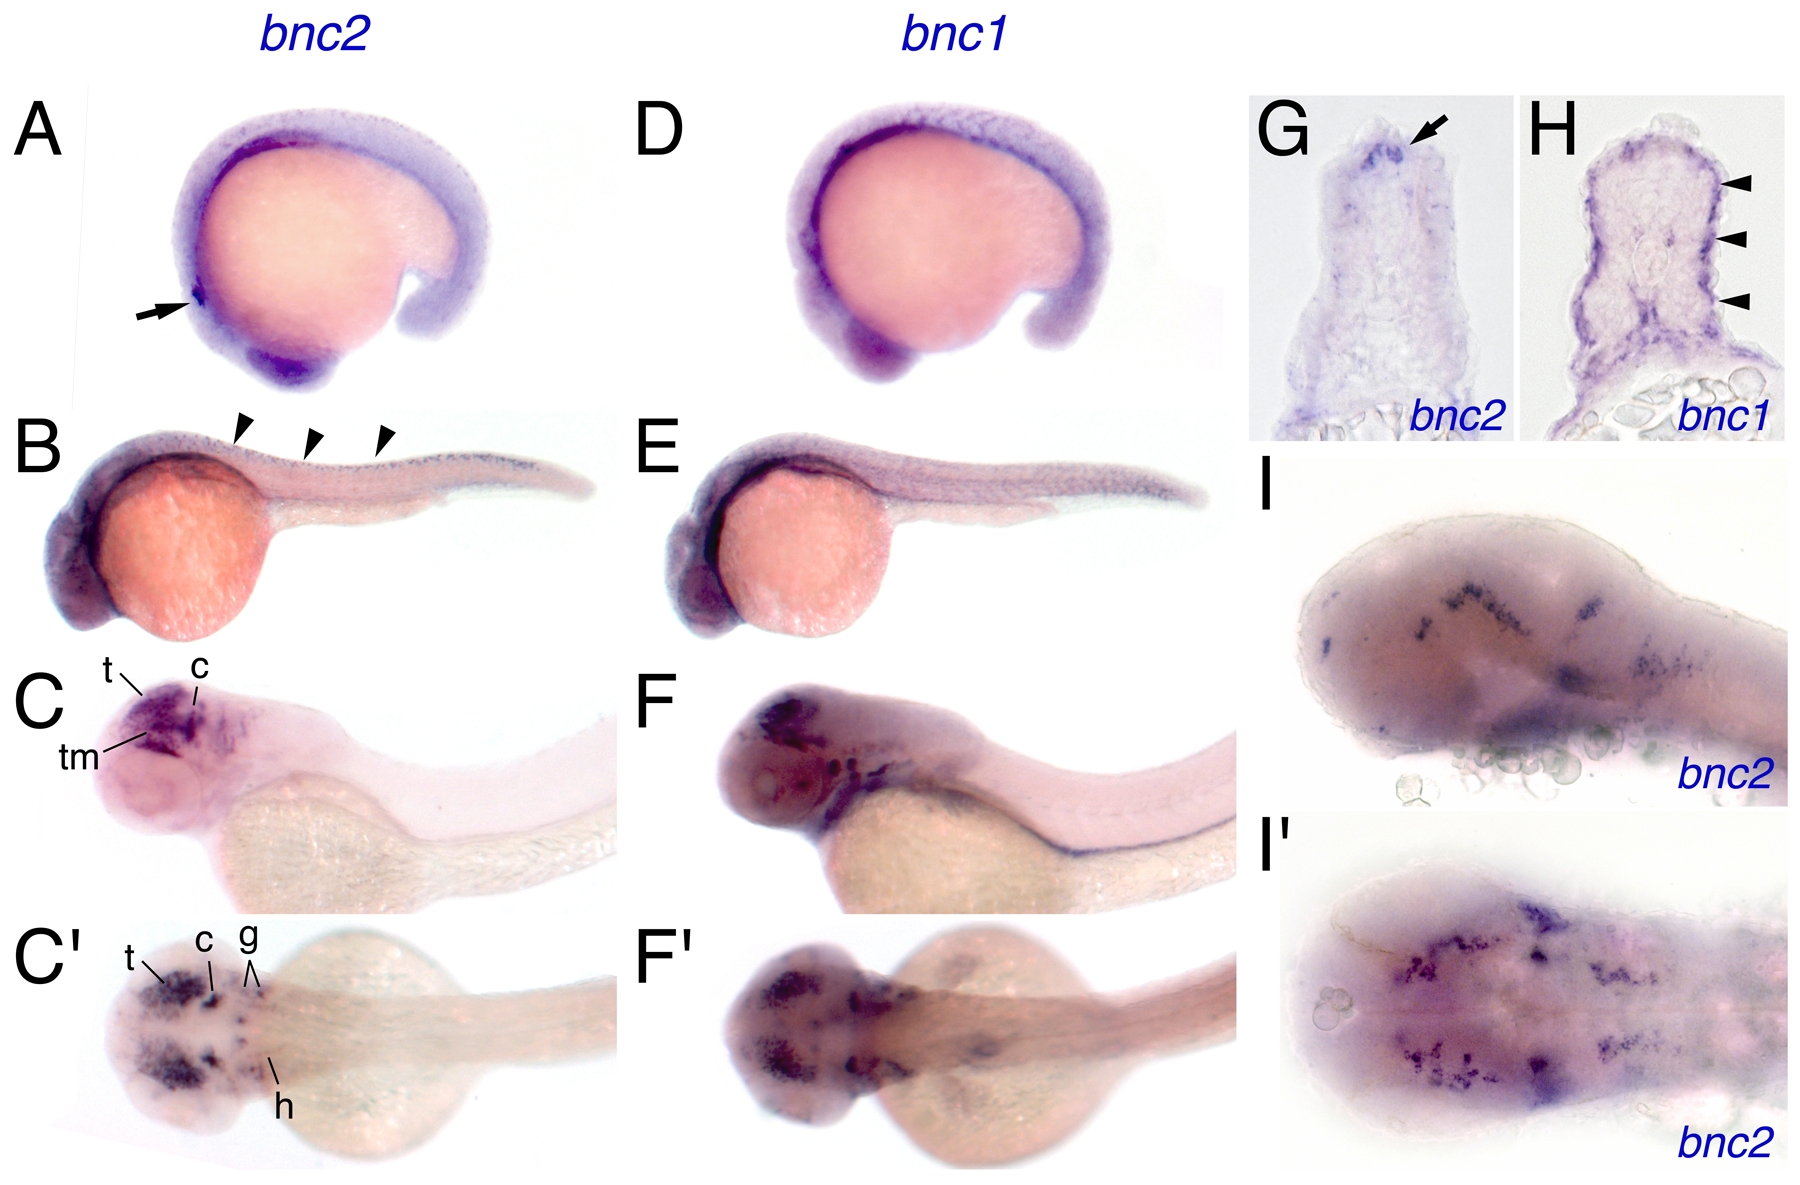
Fig. 5 Embryonic expression of bnc2 and bnc1.
(A) At 18 hpf, bnc2 was expressed broadly in ectodermal and mesodermal tissues with particular expression visible in otocyst (arrow). (B) At 24 hpf, bnc2 transcript was present within the dorsal neural tube (arrowheads) and within the anterior central nervous system. (C,C′) At 48 hpf, strong bnc2 expression was limited to the brain and cranial ganglia shown in lateral (C) and dorsal (C′) aspects. t, tectum; tm, tegmentum; c, cerebellum; g, cranial ganglia; h, hindbrain neurons. (D) bnc1 was expressed similarly to bnc2 at 18 hpf. (E) At 24 hpf, bnc1 transcripts were seen in the myotomes and throughout the head anteriorly. (F,F′) At 48 hpf, bnc1 was expressed widely at low levels and at higher levels within the brain, cranial ganglia, and pronephric duct. (G) In transverse section at 24 hpf, bnc2 transcript was present in the dorsal neural tube (arrow). (H) Simultaneously, bnc1 transcript could be seen lining the outer edges of the myotome (arrowheads). (I,I′) Details of the bnc2 expression in the brain and cranial ganglia at 36 hpf, from laterally (I) and dorsally (I′).

