
IMAGE
Fig. S10
- ID
- ZDB-IMAGE-091214-32
- Publication
- Picker et al., 2009 - Dynamic coupling of pattern formation and morphogenesis in the developing vertebrate retina
- All Figures
- Figures for Picker et al., 2009
Image
|
Figure Caption
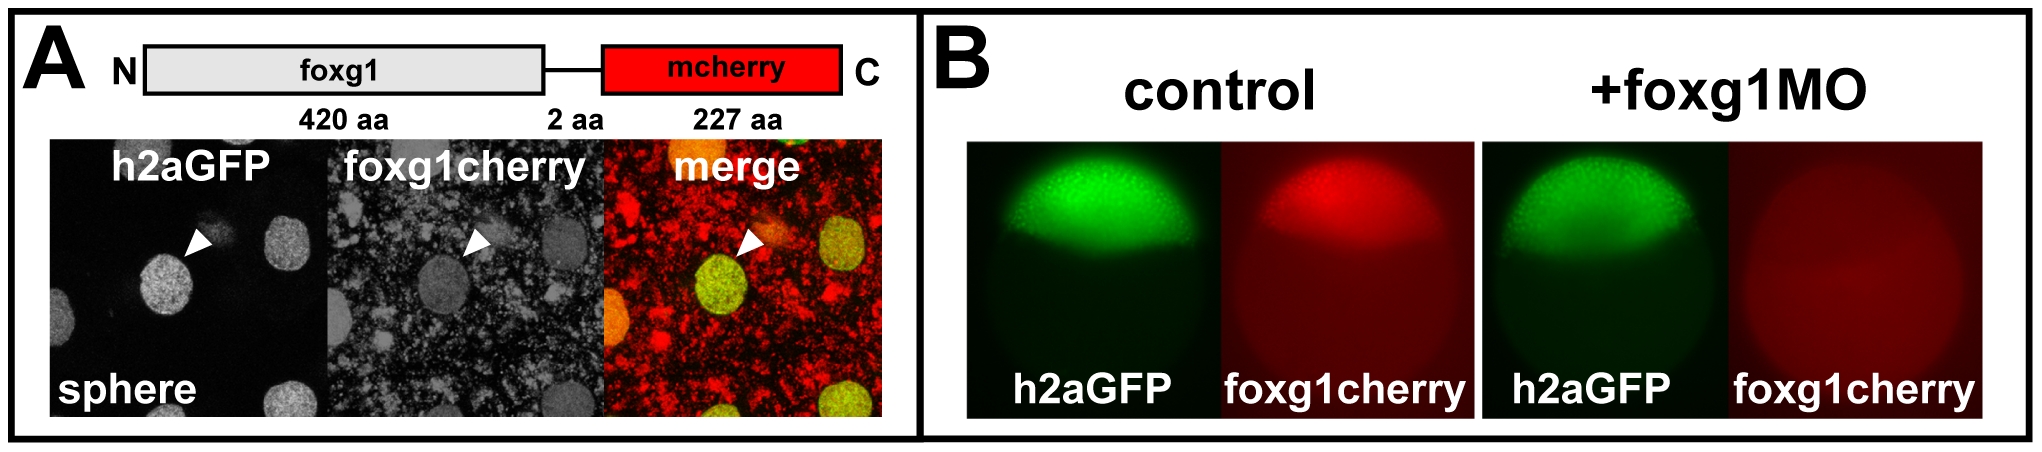
Fig. S10 Foxg1 morpholino knockdown. (A) Live image of Foxg1-cherry fusion protein expression (red) in the animal pole blastoderm in a Tg (h2afv:GFP)kca66 embryo (green) at sphere stage shows nuclear (arrowhead) and cytoplasmic localization of the protein. (B) Compared to a noninjected control (left), injection of foxg1 morpholino (foxg1MO, right) results in complete and specific depletion of the fluorescent foxg1cherry signal (red) compared to Tg (h2afv:GFP)kca66 (h2aGFP, green) in live embryos at sphere stage (lateral views, animal to the top).
Acknowledgments
This image is the copyrighted work of the attributed author or publisher, and
ZFIN has permission only to display this image to its users.
Additional permissions should be obtained from the applicable author or publisher of the image.
Full text @ PLoS Biol.